Agentic AI to turn million-token workload profiles into actionable performance insights
Learn how evidence-first harness engineering combines indexed workload data, bounded LLM analysis, and simulation evidence to improve optimization results
By Yash Phogat

This blog post was written by Alan Chen during his summer internship at Arm and is published on his behalf.
Hardware performance engineers regularly analyze enormous workload profiles. These profiles record where a program spends its execution time, including sampled instructions, functions, program locations, execution measurements, and architecture-specific details. We obtain these workloads from client and industry programs that are run through an internal performance simulation model that generates large profiles of low-level assembly. This analysis is challenging because we often lack access to the original source code, such as C, C++, or Python. Because of client data sharing restrictions, we must infer the original intent the assembly alone.
Our goal was to develop source-less microarchitectural analysis that generates hardware and software optimization ideas for Arm engineers. In this article we discuss how using recursive LLMs we improved workload optimization idea pool that got approved 4x more against the baseline.
| Function | Window weight (% of total) | PC (exact) | Sample count (simulator) | Mock assembly (AArch64) |
|---|---|---|---|---|
| <unknown_01> | 8.4% | 0x1000 | 820K | LDR X4, [X0] |
| 0x1004 | 818K | CMP X4, #0 | ||
| 0x1008 | 818K | B.EQ 0x1020 | ||
| runtime_dispatch | 5.1% | 0x2000 | 510K | LDR X3, [X1, #16] |
| 0x2004 | 509K | BLR X3 | ||
| <unknown_02> | 1.2% | 0x3000 | 122K | LDAXR W5, [X2] |
Table1. Synthetic example data of a workload profile showing function/window weight, exact instruction PCs, execution measurements, and mock assembly. JIT compilation has hidden some function names. No actual workload data is shown, and only 3 windows are displayed out of thousands in descending order. AI-generated illustration.
Here PC (program counter) is the memory address of an instruction. It acts like a location marker that identifies where an instruction appears in the program. Just-in-time (JIT) compilation is where code is translated into machine instructions while the program is running, rather than entirely before it starts. This can make function names harder for profiling tools to recover.
However, this analysis is difficult because a single profile can contain thousands of instruction windows with up to hundreds of instructions each, and unique symptoms that occur depending on the specific workload. For example, JIT compilation can modify emitted assembly, making it difficult to determine whether instructions belong to the same function. Depending on the workload, we can rarely retain function names which can provide clues about the intent of the original source code. In general, a high window weight and sample count indicate code that can substantially affect overall workload performance.
AI is useful because compiler and hardware–software optimization require interpretating large amounts of specialized information and repeated evaluation of design trade-offs. A language model can retrieve and synthesize relevant documentation, modify candidate implementations, and support iterative debugging. However, general-purpose large language models (LLMs) lack context about a specific workload. We can provide relevant context from the microarchitecture (uArch) guide and software optimization guide. These guides describe the hardware, compiler, and related software components.
On a related note, Harness Engineering has become increasingly popular for its ability to enable LLMs through context engineering, tool integration, self-improvement, etc. This is because methods like in-context learning can only do so much, and we eventually need methods like post-training, tools, or orchestration to provide better scaffolding for inference. Think about how Codex feels versus straight ChatGPT for coding. See this blog if interested.
So where to start?
The legacy production implementation used a single-pass prompting approach, but initial discussions with engineers showed that its ideas were too superficial. I evaluated several alternatives but found fine-tuning impractical with the available data. I therefore treated the task as a harness engineering and orchestration problem.
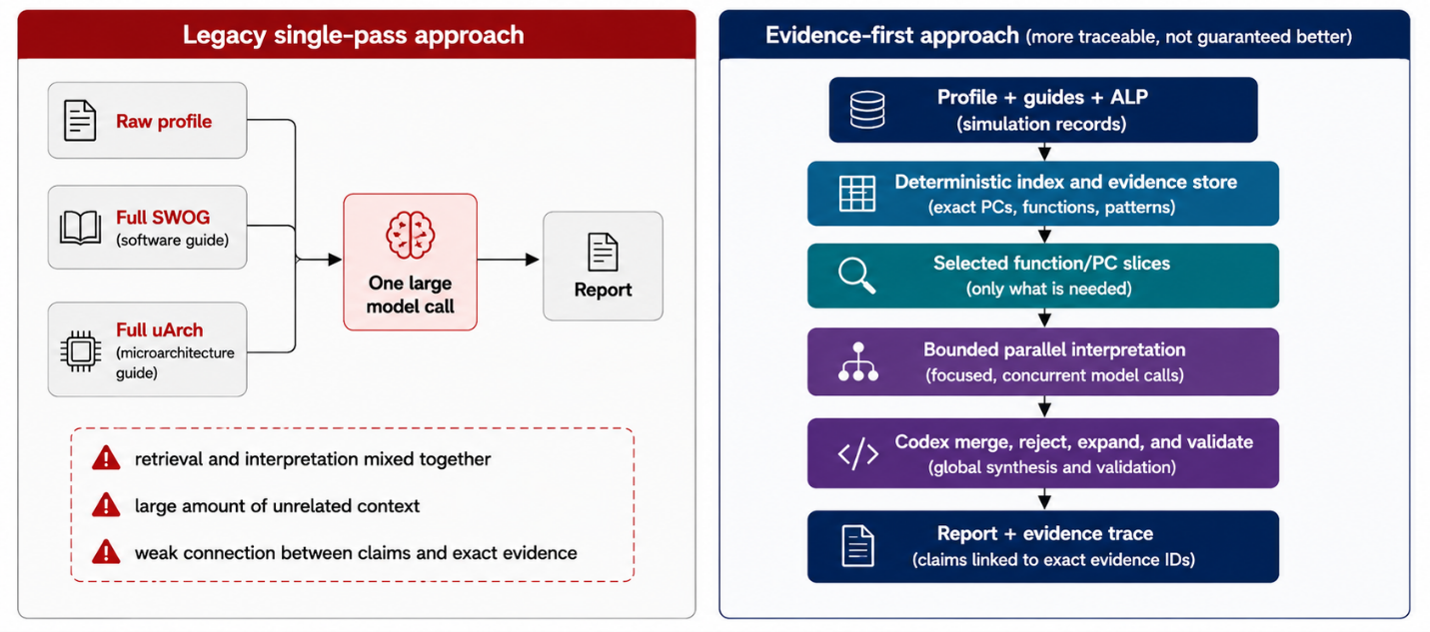
Figure 1. Legacy baseline combines retrieval and interpretation inside one large model call on the left. Evidence-first separates deterministic selection, bounded interpretation, evidence retrieval, and report generation in multiple steps on the right. AI-generated illustration.
What if we could make this workflow evidence-first? We could support each observation with direct evidence, then use the harness to expand and refine the resulting claim?
I use a two-step approach that indexes the workload and performs bounded analysis to generate optimization ideas. The model can propose what to search for, but code performs the search and calculates its coverage. The model can propose an idea, but it cannot fabricate evidence IDs or attach unrelated evidence to support the idea.
What, how, and why do we index?
GPT-5.4 supports a 1.05 million-token context window, which is large enough for most of these workloads. However, fitting an entire workload into the context window does not mean we should do so.
When given the workload and guide in a single prompt, the model tends to rephrase the guide instead of interpreting the raw assembly. When prompted to analyze the assembly profile, the model produces general claims supported by loosely related evidence. Blind reviews found that these claims were not actionable.
Instead of repeatedly adding the same context to prompts, I index the profile, guide sections, simulation records, and intermediate findings under stable IDs. Each model call receives only a few function IDs, hot PCs, and evidence IDs. It can then request the specific information it needs, such as assembly around a PC, an observation from a parallel call, or a relevant software guide section. I also store all IDs and subcalls in a UI tool that enables engineers to review the model analysis.
For indexed objects, exact ID retrieval works like a standard hash-map lookup. This approach avoids another pass through the entire workload and externalizes context into a Read-Eval-Print Loop (REPL) environment. The approach is inspired by Recursive Language Models (RLMs).
I found this approach practical because one call t can identify a pattern, store the finding with supporting IDs, and another call can retrieve that evidence instead of relying on a compressed summary.
The indexing process has several stages. First, we provide the profile into functions and instruction window. We calculate their weights from their share of the total cycles and we then sample the top N results or contine until we reach sufficient coverage. We then index exact PCs, opcodes, and instruction sequences. We also identify patterns worth investigating such as atomics, ordering operations, and indirect control flow using BR or BLR instructions.
Not all these behaviors indicate a performance problems. For example, frequent branching can reflect an intentional design pattern. It can also result from behavior elsewhere in the workload that affects performance. These patterns give Codex credible evidence from which to investigate potential performance issues. Future work will supplement this evidence with indexed global performance metrics.
The next step is more flexible. Codex can generate its own indexes, while engineers can provide prior knowledge to guide the search. Codex can use an identified pattern as an anchor for further analysis. It can request regular expression searches or groupings across the full workload in the REPL. Scripts then calculate key metrics for the retrieved results. Codex uses these metrics to retain, merge, or discard results, or to investigate related behaviors further.
Guide integration information
At runtime, the legacy baseline included the uArch and software optimization guides which contained descriptions written by engineers or agent skills. Instead of providing both guides, I retrieve only the sections relevant to the evidence in each analysis slice. This approach reduces the prompt size and enables the model to focus on workload-specific problems. It also reduces the likelihood that the model will rephrase observations from the guides.
The uArch guide provides a lossy description of the actual microarchitecture. As a result, the model can lack local information and might need to speculate. To provide this local information, I use an internal performance simulation tool that emulates the uArch and integrate an artifact that the tool generates called the Average Loop Pipeview (ALP).
The ALP provides exact-PC branch, load and store, and pipeline information from the performance simulation model. This information provides more detail about a specific location than the workload profile alone. The profile can identify a hot BLR, while the uArch guide can explain why indirect branches are generally expensive. However, neither indicates whether that specific BLR is mispredicting and the ALP provides this local measurement.
According to a senior engineer, raw ALPs had not previously been considered because of their size. Across 3 workloads, the raw ALPs ranged from approximately 8.66 million to 16.98 million tokens, far exceeding the model context limits.
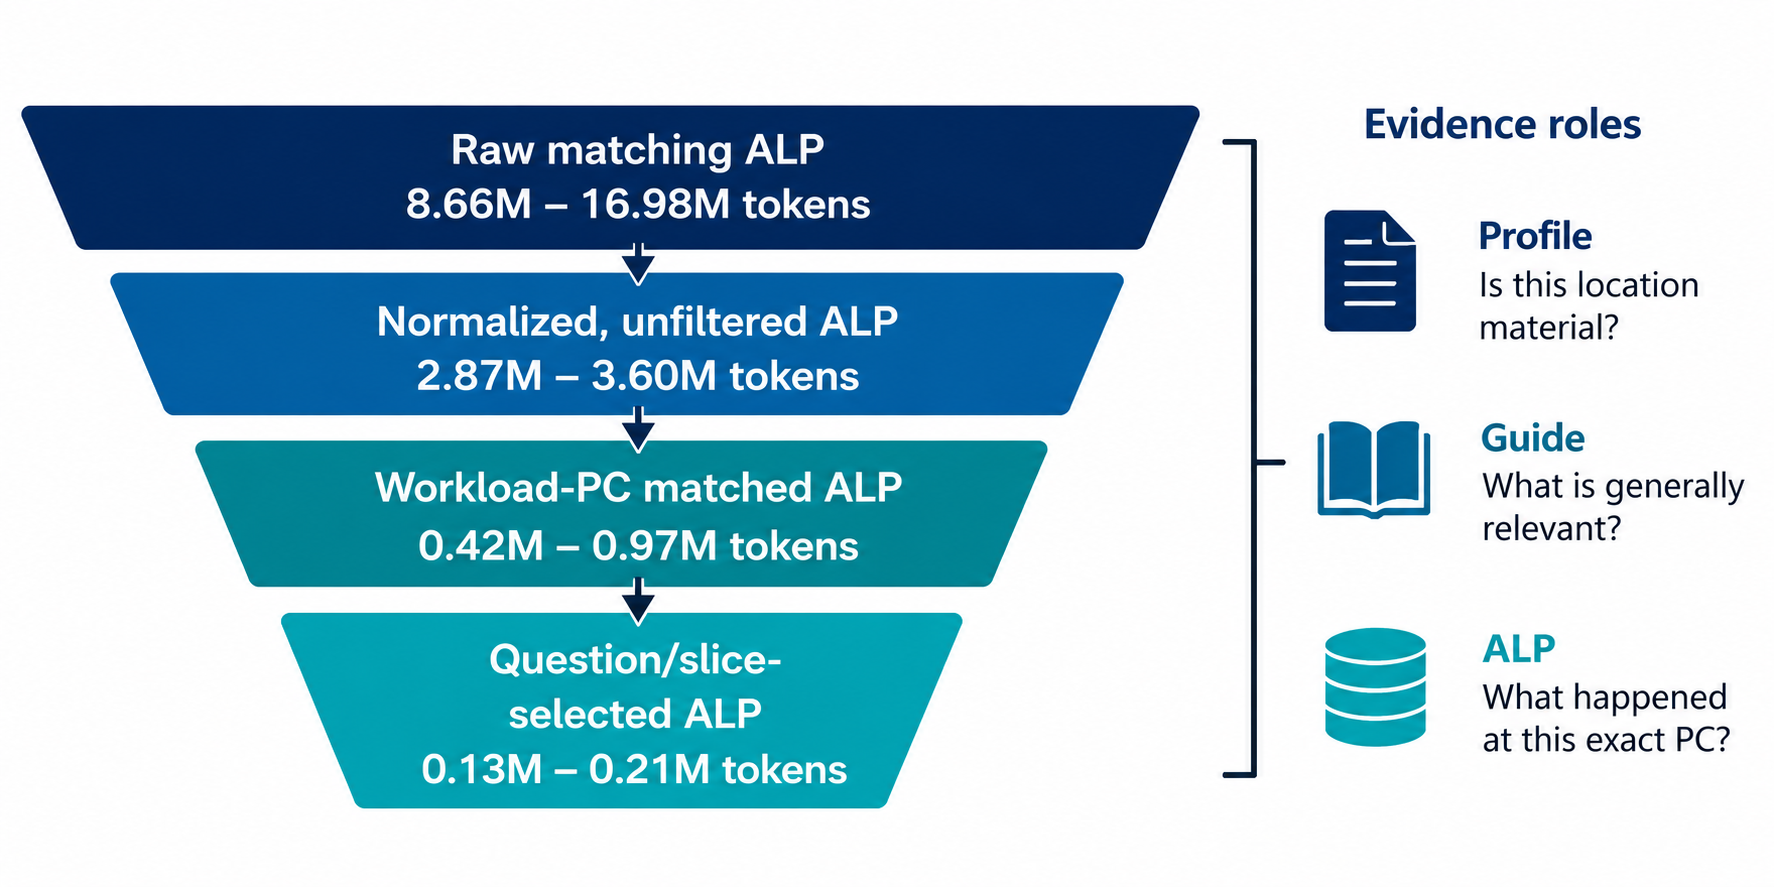
Figure 2. Average Loop Pipeview aggregation and trimming to be used as localized evidence (top 3 steps are deterministic). AI-generated illustration.
My approach indexes the workload before identifying observations independently of the guides. At runtime, I filter for indexed slices and exact-PC matches when the model queries a PC. This reduces the token count to 132,000-213,000, as shown in Figure 4. Blind reviews also found that reducing ALP context by more than 50,000 tokens improved the quality of the generated ideas.
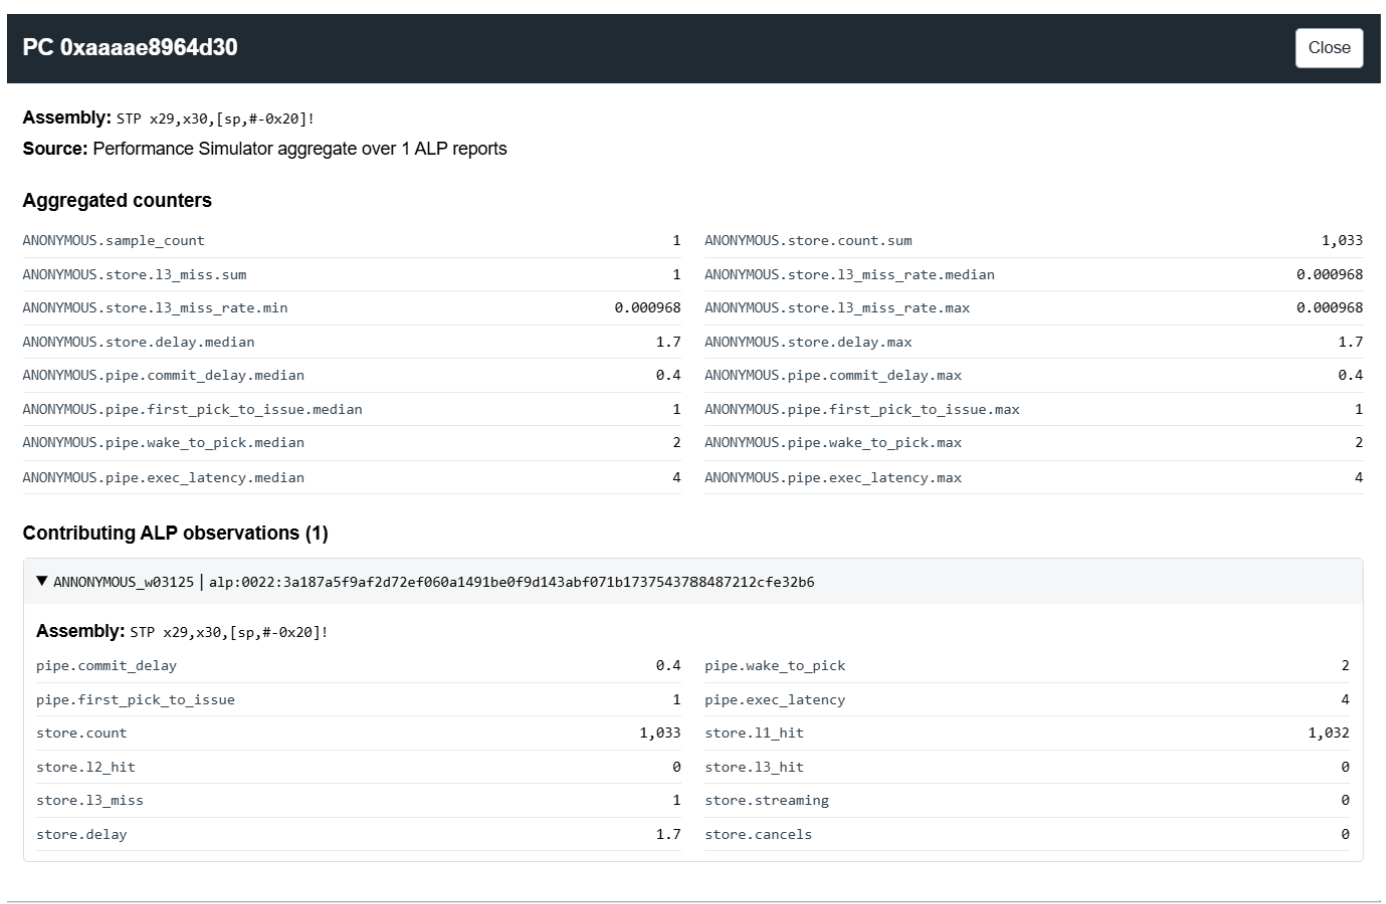
Figure 3. Average Loop Pipeview evidence example for a specific aggregated PC. Obtained from the observability tool I developed.
While ALPs are useful, they do not reveal the intent of the original source code or whether a proposed rewrite is valid. However, ALP data helps distinguish general speculation about an instruction pattern from evidence of measured behavior at a specific site.
Bounded analysis with Codex orchestration
The process has 4 main steps:
- Index the source material.
- Run bounded interpretation calls concurrently. Each call receives only its assigned evidence and any exact matching ALP or guide section.
- Validate that each output references only evidence available to that call.
- Use Codex to review across all calls, merge duplicates, reject unsupported claims, or request further investigation when important questions remain unresolved.
The implementation also includes additional logic for tracing, schemas, and budges, which is omitted here for brevity.
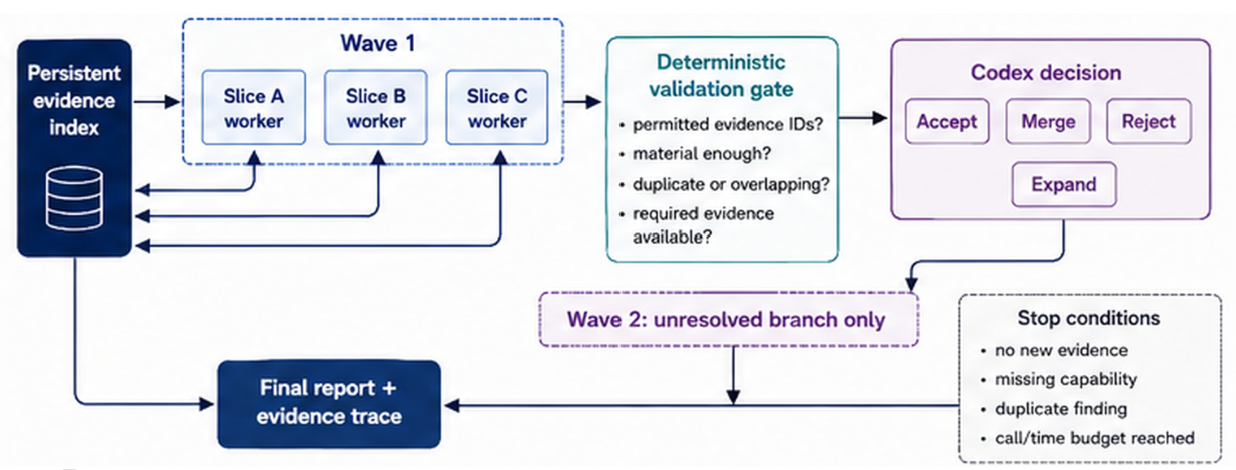
Figure 4. Bounded analysis launches focused calls concurrently, validates their evidence, and only expands unresolved findings that could add new information. The orchestrator, Codex in the top right, uses a model-replaceable interface. AI-generated illustration. Here, we can allow for waves to be arbitrarily long (N-deep) but for production purposes, I found depth=2 to be the best.
The orchestrator runs subcalls concurrently in waves and stores their results in a REPL environment and persistent index. Codex acts as a gatekeeper that evaluates the cycles spent, identifies duplicate ideas, and checks the evidence that supports each observation (see Figure 4).
Results
To standardize the inputs across users, I packaged the approach as a SKILL with scripts and presets. I then tested it on real-world client and infrastructure workloads. The client workloads came from programs running on phones, while the infrastructure workloads came from programs running on servers. The following analysis covers 3 workloads approved by Arm engineers with some details omitted for privacy reasons.
Workload A: Flat infrastructure profile with behavior spread across many runtime and anonymous windows.
Workload B: Lookup-heavy service profile where memory locality was the main question.
Workload C: Framework and runtime profile containing indirect dispatch and dependent-load behavior.
| Workload | Legacy full prompt | ALP-assisted | Difference |
|---|---|---|---|
| Workload A | 23 | 27 | +4 |
| Workload B | 17 | 28 | +11 |
| Workload C | 19 | 29 | +10 |
Table 2. Initial ALP ablation using an identity-masked comparison with an LLM as a judge. Scores combine usefulness, novelty, grounding, expected upside, guide fit, and follow-up clarity. Scores sum up to 30 and are averaged.
| Workload | Legacy full prompt + window ALP | Full prompt + my method ALP | Bounded analysis + my method ALP | Best result |
|---|---|---|---|---|
| Workload A | 21 | 25 | 28 | Bounded +ALP |
| Workload B | 22 | 26 | 27 | Bounded + ALP |
| Workload C | 22 | 29 | 28 | Full prompt + my method ALP |
Table 3. Fixed-slice evidence-delivery ablation with an LLM as a judge. Scores combine usefulness, novelty, grounding, expected upside, guide fit, and follow-up clarity. Scores sum up to 30 and are averaged.
The table results are scores from a blind judge, averaged across multiple trials. An LLM judge is an imperfect measure of novelty, but it provided a quick , low-cost method for the initial evaluation. Overall, is the results in Table 1 favor my approach over the full prompt method.
When we vary the ALP information provided, the legacy approach performs better overall but still scores lower than the new approach. Reusing the ALPs selected by bounded analysis substantially improves the full-prompt results. For 1 workload, the full-prompt approach even performs better. Further investigation is needed, but the results suggest that analysis-selected evidence accounts for much of the improvement. Greater analysis depth provides additional benefits for some workloads.
Usage feedback so far generally favors the evidence-first bounded approach. However, the engineer's sample size is too small to support statistically conclusive results. Future work can include evaluation with a larger sample.
Qualitative feedback is also promising. In a detailed review, 1 subject matter expert (SME) found that “A’s (baseline) idea 2 is interesting but needs more thought into whether it is applicable, while B’s (new approach) Ideas 2-6 can directly guide compiler optimizations.”
Across client and infrastructure workloads, the same SME compared 6 identity-masked ideas from each report. The SME approved 4 times as many hardware and software optimization ideas from the new approach as from the baseline.
I also measured the end-to-end operational cost across 5 anonymized client workloads. The comparison shows a tradeoff in runtime and model cost. However, it does not include the engineering effort required to review unsupported recommendations or prototype ineffective changes.
| Metric | Legacy approach | New approach | Relative cost |
|---|---|---|---|
| Total model calls | 5 | 60 | 12.0× |
| Workload B | 267,055 | 838,728 | 3.14× |
| Workload C | 135.7 seconds | 462.6 seconds | 3.41× |
Table 4. End-to-end runtime and token-cost comparison across anonymized client-oriented workloads.
Evolving model capabilities and future research could affect these observations and global performance metrics could further improve workload analysis.
Future work could use accumulated traces and accepted ideas to improve workload decomposition, stopping criteria, and evidence retrieval. These improvements could enable agents to investigate workloads more deeply while remaining grounded in measurable behavior.
A well-designed orchestrator and harness could enable subcalls to investigate promising ideas at greater depth. However, in my evaluations, the agent rarely needs to progress beyond a depth of 2. Further investigation could determine whether downstream recursive subcalls can make useful logical connections between analysis stages.

By Yash Phogat
Re-use is only permitted for informational and non-commercial or personal use only.
