Understand, debug, and optimize AI Models for Arm with Google Model Explorer
Explore how Arm adapters for Google Model Explorer help developers visualize AI models, inspect graph transformations, and identify performance bottlenecks

Summary
Millions of machine learning models run locally on Arm devices, from edge devices to physical AI systems. Models are often transformed and quantized for a target device, which can feel like a black box for developers. Google AI Edge Model Explorer helps developers understand these transformations. It provides a layer-by-layer view of AI models, from large language models (LLMs) to neural graphics models, showing how they change during deployment to runtimes optimized for Arm.
Arm has contributed three open-source adapters, which make it easier for developers to explore Arm-relevant model formats and compilation flows directly in Model Explorer.
Now available on GitHub, these adapters add support for the following formats:
- TOSA (Tensor Operator Set Architecture) for Arm CPUs and Arm Ethos-U.
- VGF that enables visualization of VGF files from Arm ML SDK for Vulkan® for neural graphics and GPU workloads, and can be used with the Arm Neural Accelerator.
- PTE ExecuTorch files that enables visualization of PTE files for Arm Ethos-U NPU Backend, Arm® VGF Backend and XNNPACK targets.
- ExecuTorch adapter extension, a combined extension package that visualizes
.etrecordgraph files and overlays runtime profiling data from.etdpor.etdumpfiles onto ETRecord graphs.
Human-in-the-Loop Debugging with Model Explorer
Three real-life examples show how Arm developers used these adapters in their workflows to inspect model transformations, validate delegated regions, and improve confidence before deployment.
Example 1: Validating neural graphics models with VGF
Developers need to verify that a model’s graph structure and operators appear as expected after export. In a series of public neural graphics demonstrations, first shown at the 2025 Game Developer Conference, Model Explorer helped validate a neural super sampling (NSS) model trained in PyTorch. The Neural Super Sampling (NSS) model was exported through the ExecuTorch Arm backend as a VGF file, the format used to deliver neural networks to the ML Extensions for Vulkan API.
Model Explorer’s extensible plugin architecture made it possible to add support for VGF and inspect the exported model directly. The graph overview shows the model’s inputs, graph partition, and outputs, providing a starting point for checking the exported structure before deployment.
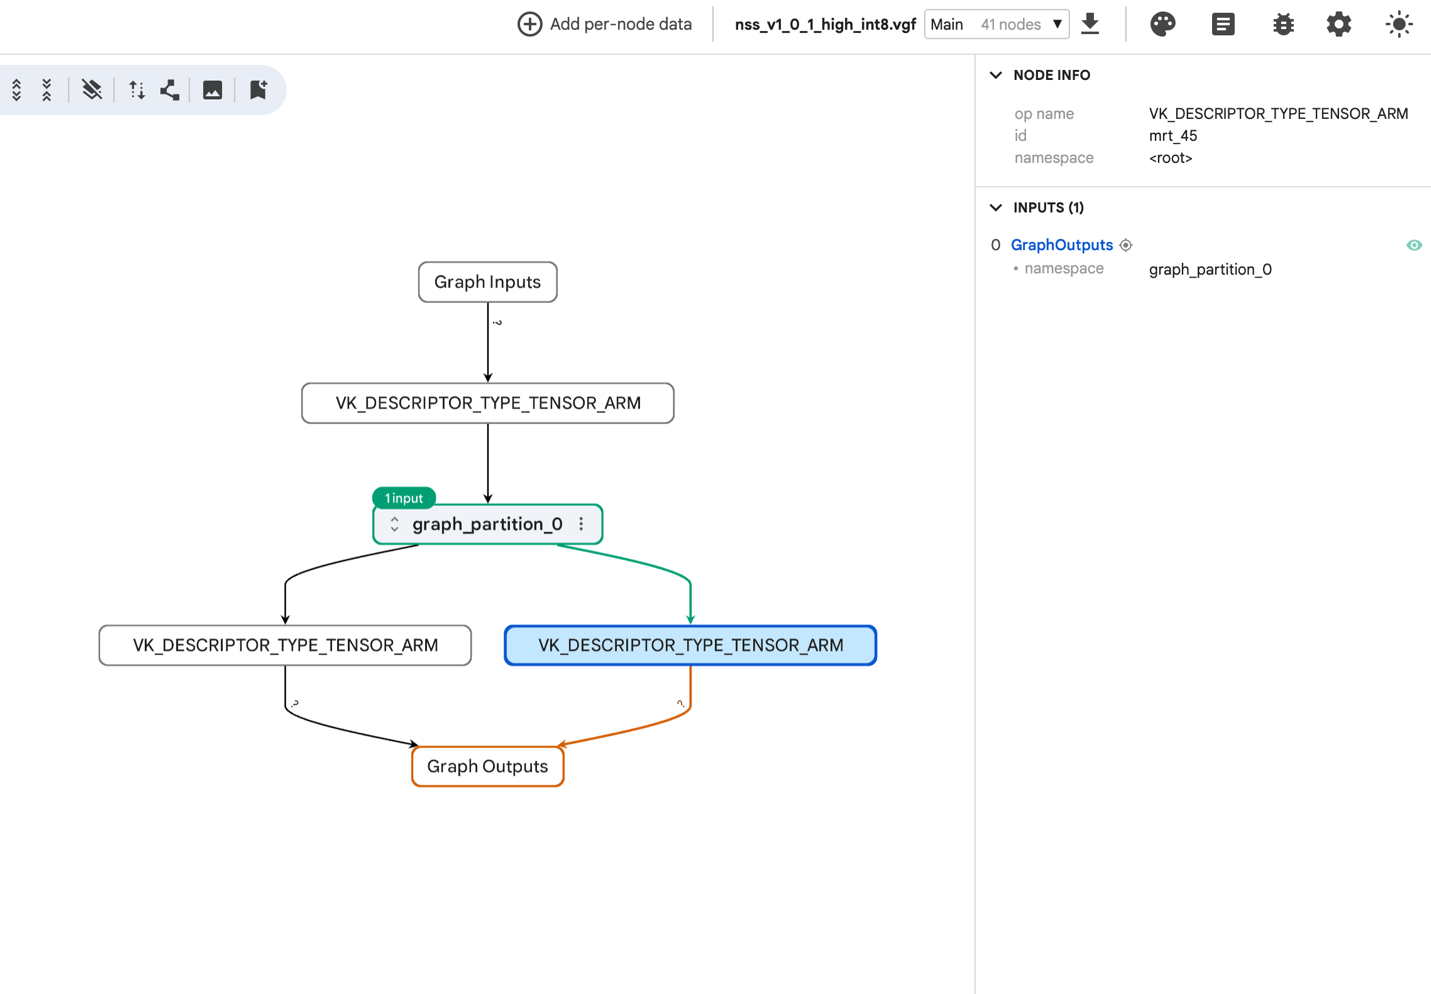
Iterative graph inspection helped identify the unwanted transpose operators introduced by a change to the ExecuTorch Arm backend. This enabled the team to fix the issue much faster than checking through raw data. Visual inspection turned an unexpected export change into a specific issue the team could investigate and resolve.
Expanding a graph partition and selecting individual nodes reveals operator attributes and tensor connections. The detailed view below shows a rescale operator and its inputs and outputs, helping developers inspect how operations are connected within the exported model.
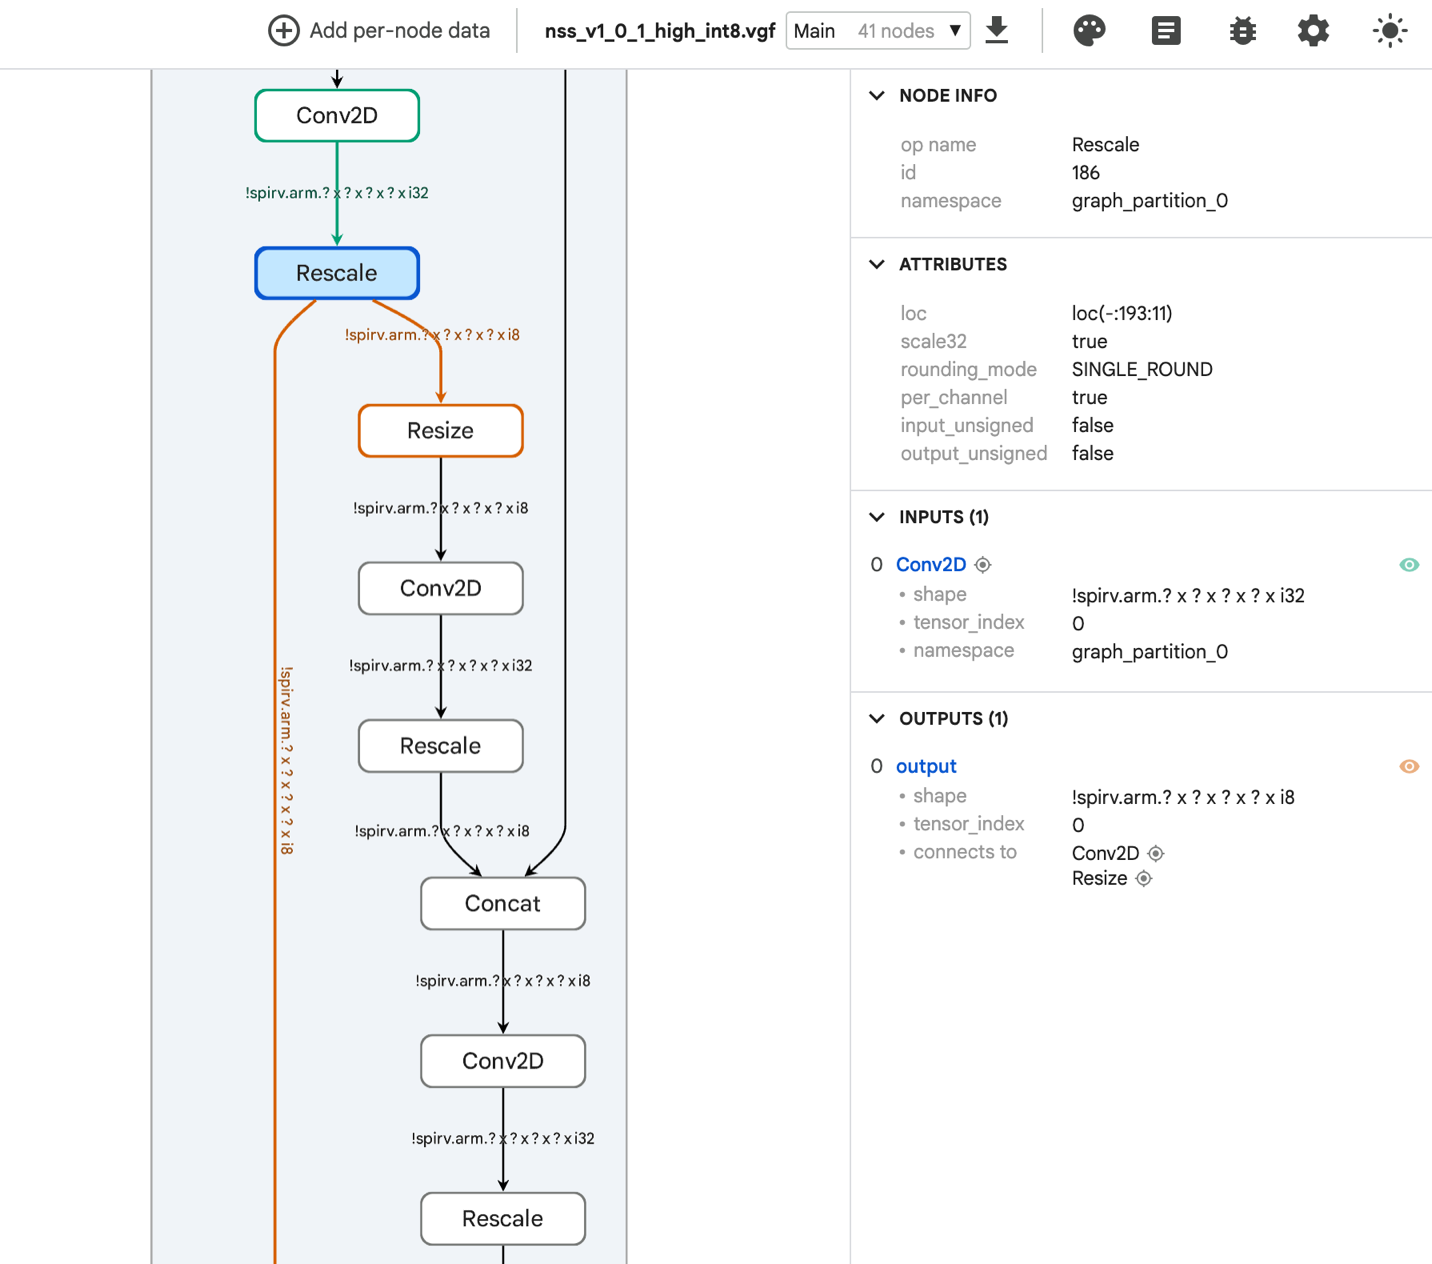
The same visual workflow supported the public demonstrations. Exploring the model interactively made it easier to explain the network structure and deployment pipeline to attendees, while providing a clear view of the model being prepared for deployment.
Example 2: Arm CPU and Ethos-U85 YOLO graphs
Developers need to understand whether a model can be fully delegated to their target backend or whether some operations still run on the CPU. A real-world use case of extracting the maximum performance from the accelerator is real-time object detection. It demands low-latency vision processing close to the sensor, often within tight power and memory constraints.
We converted the Ultralytics YOLO model to TOSA format for the Arm Ethos-U85 NPU.
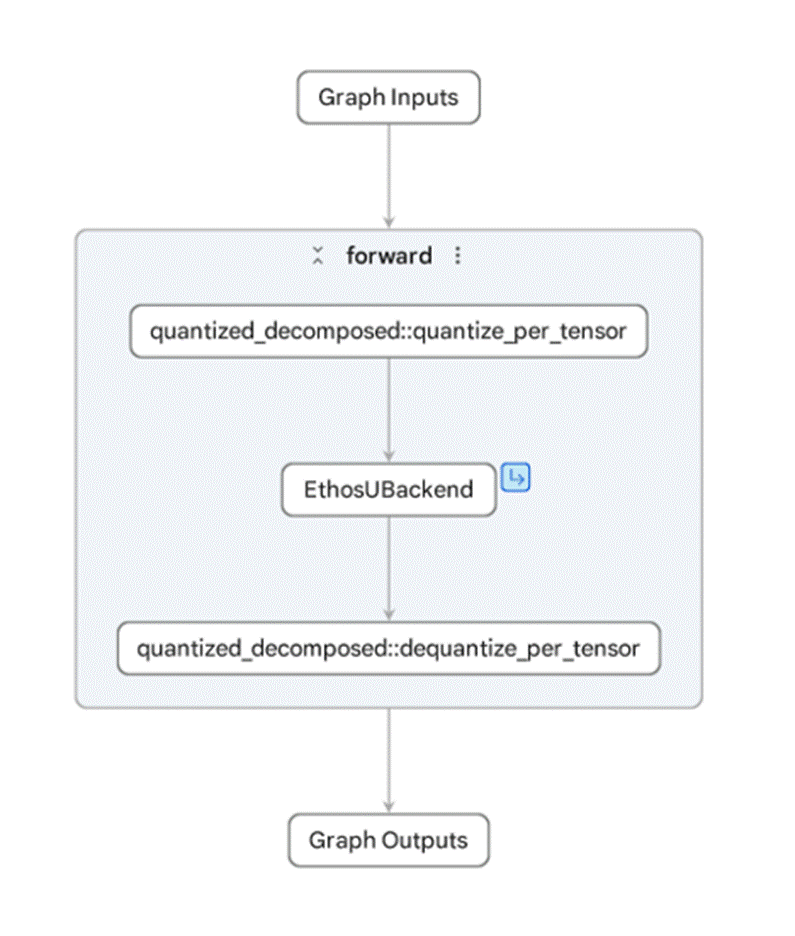
Figures 3 and 4 compare the CPU and NPU graphs of the same Ultralytics YOLO model. The NPU graph is much simpler, with most operations delegated to the EthosUBackend.
Now this is much easier to understand! Developers can save time by easily seeing issues and seeing what backends are supported immediately. The main network is represented as a single EthosUBackend block, wrapped only by the required quantize and dequantize steps.
AI Edge Model Explorer has helped the team understand that this is another practical reason to use Ethos-U for suitable models. Beyond acceleration, the delegated graph can reduce the amount of model complexity that has to be handled directly by the CPU execution path.
For more complex or partially supported models, whether using LiteRT or ExecuTorch, the same view can quickly reveal where lowering is incomplete, where unsupported operations remain outside the delegated region, or where fragmented subgraphs may affect performance or compatibility on the target. Any fallbacks or unsupported regions then become concrete points for further investigation, rather than remaining as hidden behavior in the deployment flow.
Example 3: Ethos-U performance data tracing
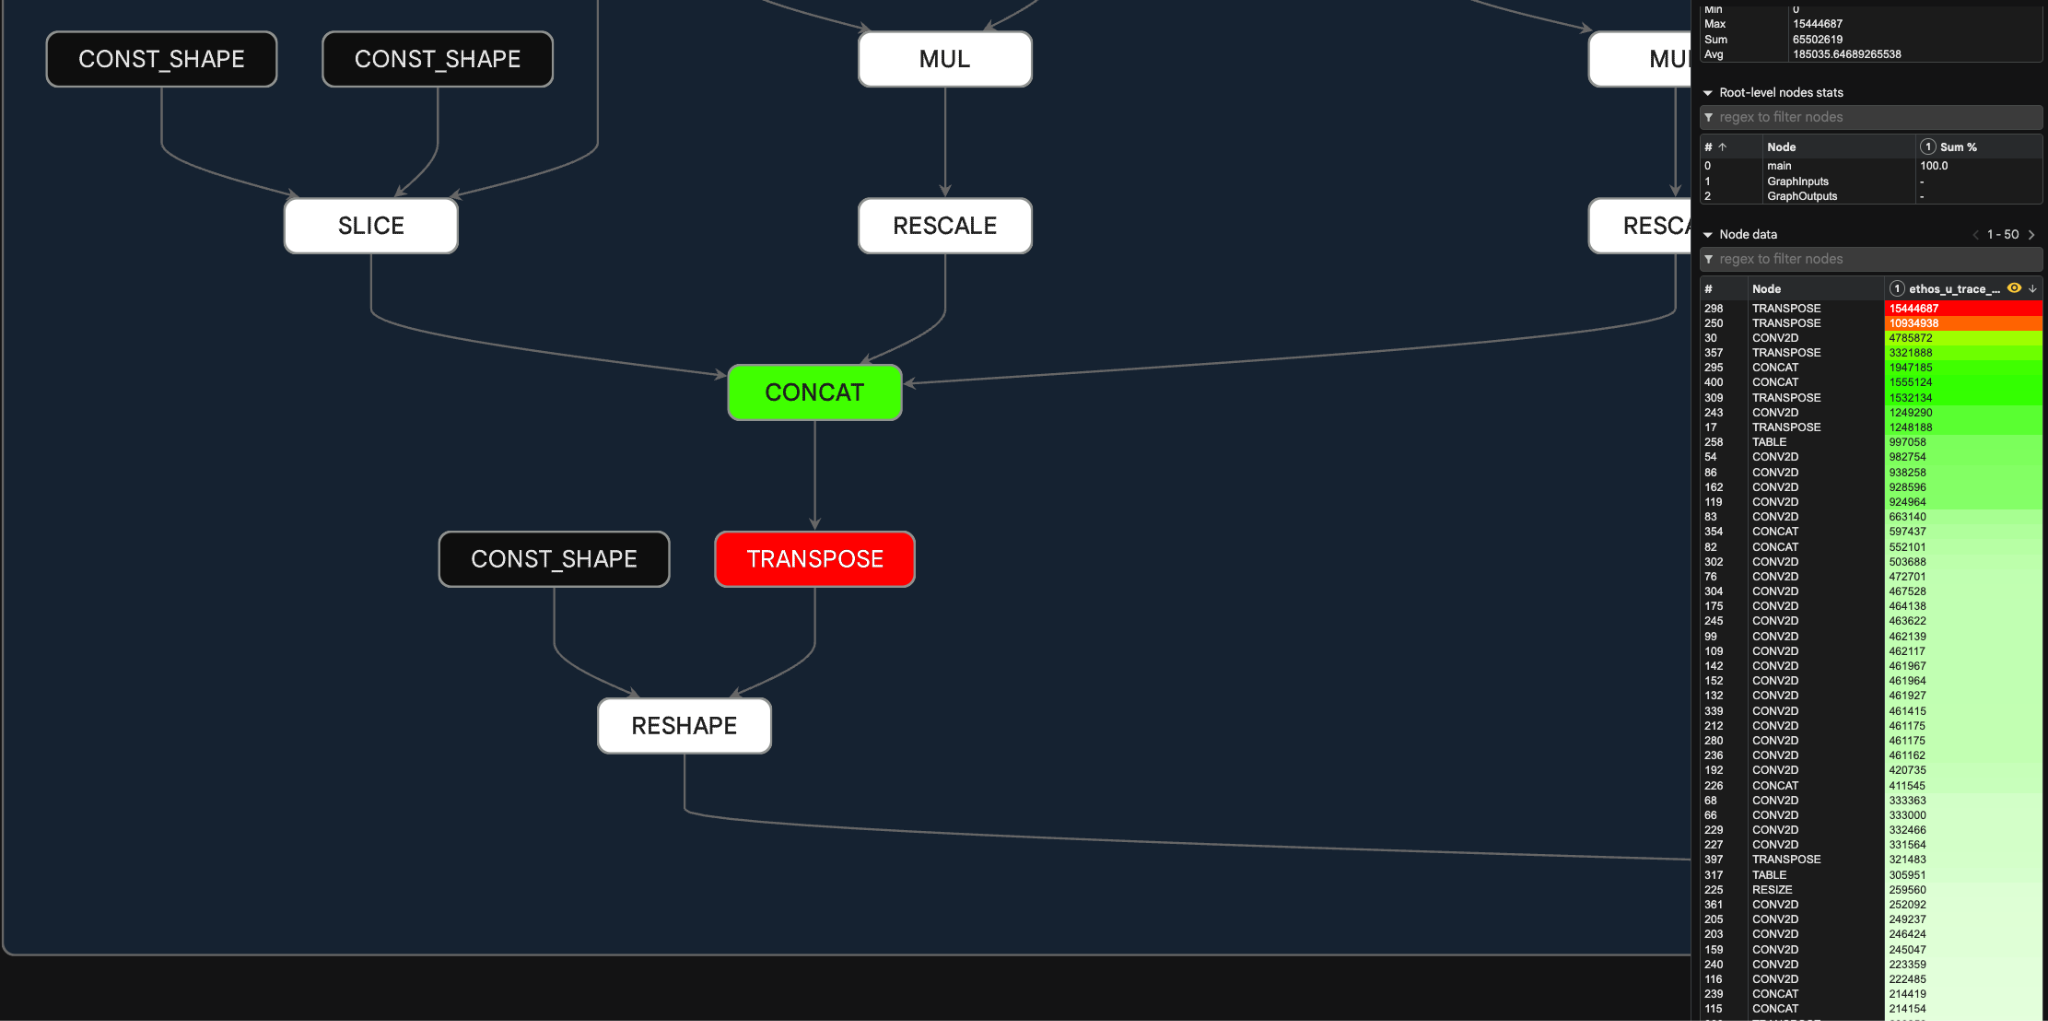
Developers often wonder where the bottleneck is in their graph. In this example, we overlaid the trace data by using Model Explorer’s node data plugin. We compiled and ran the model on the Arm Fixed Virtual Platform (FVP) for Ethos-U, then used the Ethos-U trace overlay in Model Explorer to visualize the performance data. Clearly, the TRANSPOSE node is a performance bottleneck. This insight helps the team quickly focus on the node to optimize for, which should improve performance. Developers will be able to reproduce this workflow using the Arm run scripts in ExecuTorch and the upcoming Ethos-U node provider.
How to get started
You can get started today with the Google Model Explorer adapters from Arm:
- Install the adapter that matches your model and use case: PTE for ExecuTorch
.ptefiles, TOSA for TOSA flatbuffer, or VGF for neural graphics models. - Launch Google Model Explorer with the matching
--extensionsflag. - Upload a
.pte, TOSA flatbuffer, or VGF file in the browser UI. - Open a second model in split view to compare two export paths, such as CPU-oriented and delegated outputs.
- Inspect delegated regions, CPU fallback operations, graph boundaries, and metadata overlays.
Google Model Explorer, and the Arm adapters, can be installed locally on your device from PyPi packages and via Python files through GitHub.
First install Google Model Explorer:
pip install torch ai-edge-model-explorerYou will then need to launch Google Model Explorer with the matching --extensions flag.
With Google Model Explorer installed, install the adapter for your format, then launch it using the matching command.
| Format | Install the adapter | Launch |
|---|---|---|
| VGF files: inspect models from the Arm ML SDK for Vulkan with the VGF adapter. | pip install vgf-adapter-model-explorer |
model-explorer --extensions=vgf_adapter_model_explorer |
| TOSA FlatBuffer files: inspect TOSA graphs with the TOSA adapter. | pip install tosa-adapter-model-explorer |
model-explorer --extensions=tosa_adapter_model_explorer |
| ExecuTorch graphs and profiling: inspect .pte and .etrecord files and overlay runtime profiling data using the combined ExecuTorch adapter extension. | pip install executorch-extension-model-explorer |
model-explorer --extensions=executorch_extension_model_explorer |
| ExecuTorch PTE files: inspect .pte models with the PTE adapter. | pip install pte-adapter-model-explorer |
model-explorer --extensions=pte_adapter_model_explorer |
After Google Model Explorer starts, open its local address in your browser and upload your model or graph file.
For ExecuTorch profiling, first open an .etrecord graph, then select ‘Add per-node data’ and then select ETDump Profiling Overlay. Upload your .etdp or .etdump file, and run the provider to display runtime latency metrics on the graph.
What is next?
This is a step toward a richer model workflow and visualization inspection experience for developers targeting Arm platforms.
A preview integration between Arm ML Inference Advisor (MLIA) and Model Explorer is now available in VS Code, with a public release planned for the future.
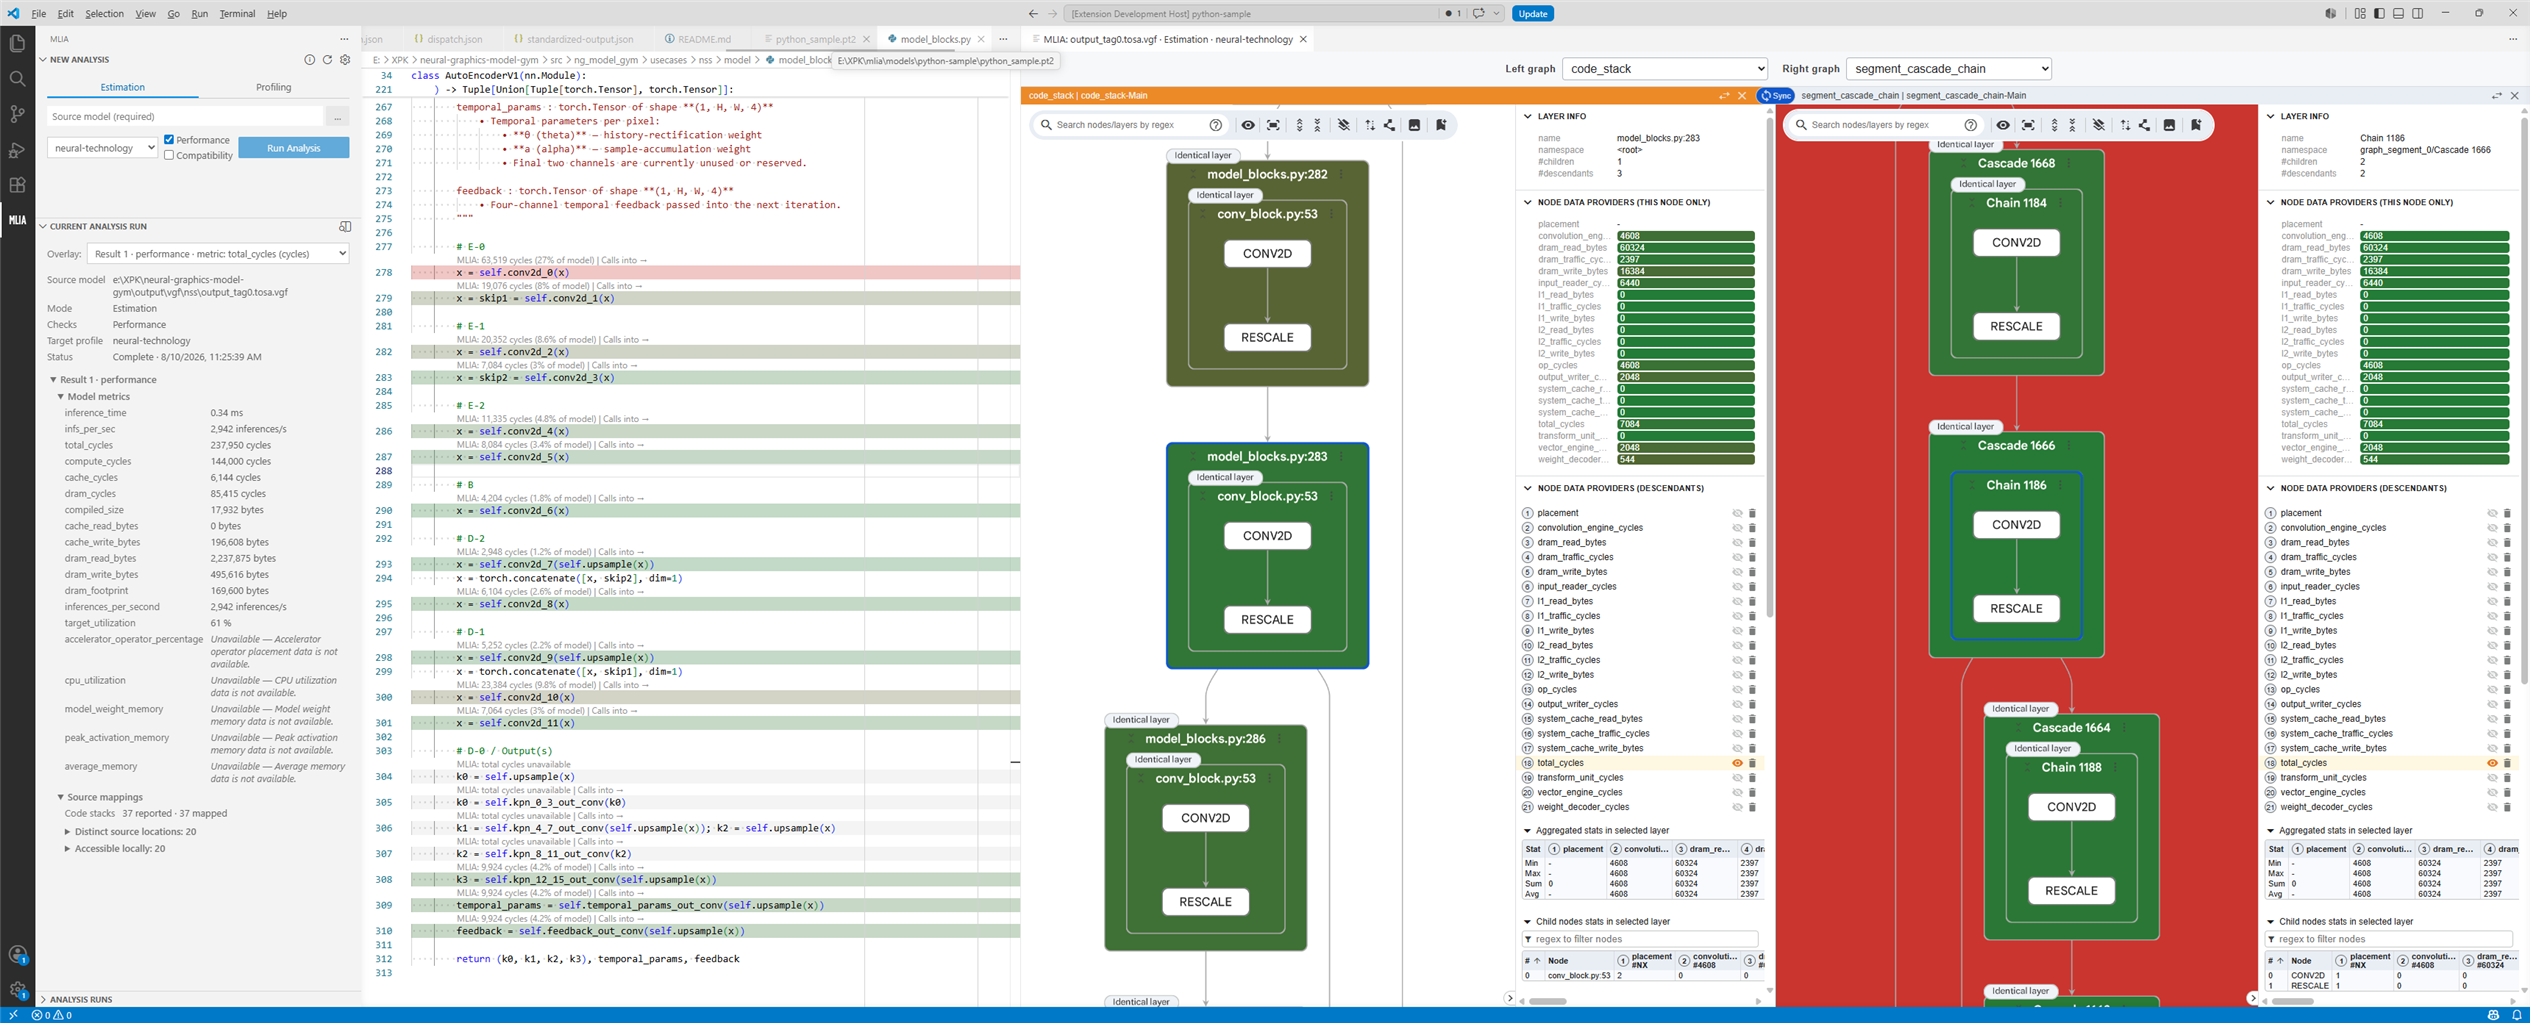
MLIA checks compatibility with supported Arm targets and provides performance estimates or profiling results, with advice to guide optimization. Developers will be able to view metrics such as operator cycle counts on model graphs and, where source mappings are available, connect them to the corresponding code. Building on the examples above, this will help developers investigate expensive operations, understand model transformations, and identify changes to test before deployment. This is now available as a preview in VSCode.
Future enhancements planned include adding more performance analysis, and overlays to understand quantization. We are looking forward to continuing working with Google and the wider developer community to expand what developers can do on our platforms, and help them visualize, debug, and optimize.
References
- Google AI Edge Model Explorer: https://ai.google.dev/edge/model-explorer
- Arm VGF adapter for Model Explorer: https://github.com/arm/vgf-adapter-model-explorer
- Arm TOSA adapter for Model Explorer: https://github.com/arm/tosa-adapter-model-explorer
- Arm PTE adapter for Model Explorer: https://github.com/arm/pte-adapter-model-explorer
- Arm ExecuTorch adapter for Model explorer: https://github.com/arm/executorch-extension-model-explorer
Acknowledgements
We would like to thank Na Li, Eric Yang, Jing Jin, Alan Ma, Ami Kubota, Alice Zheng, and Derek Bekebrede from Google for their valuable contributions and collaboration on the Google Model Explorer integrations.
Re-use is only permitted for informational and non-commercial or personal use only.
