Apache Arrow optimization on Arm
This blog introduces Arm optimization practices with two solid examples from Apache Arrow project.
By Yibo Cai

This blog introduces Arm's contribution in Apache Arrow project and some best practices of workload optimization on Arm.
Two real-world optimization cases are included:
- Use Top-down methodology to identify performance bottleneck
- Use Arm SPE (Statistical Profiling Extension) to locate performance critical code
Apache Arrow introduction
Apache Arrow is an open standard for efficient columnar data interchange. It designs carefully a bunch of data structures which can be moved without the cost of ser-/deserialization, and are highly efficient for in-memory computation. Besides the data format, Arrow also implements a fully fledged library to facilitate the implementation of high-performance data analytics.
Arrow eliminates Ser-/Deserialization overhead
![]()
The previous diagram shows the issue Apache Arrow tries to address.
The left side figure is the condition before Apache Arrow. The below four dark blue squares (Parquet) are big data storage or database projects, they have their own data formats. The upper four light blue squares (Spark) are in memory data analytic projects, they also have their own data formats.
It is common that several open-source projects need to work together to solve a real-world problem. There will be considerable overhead to do data format conversion across these projects, such as serialization and de-serialization. It is a huge waste of resources and hurts performance severely.
As the picture on the right side illustrates, Apache Arrow is designed to address the issue. It defines an open standard for efficient columnar data interchange. It unifies the language across big data projects. With Apache Arrow, all on-disk data is loaded to the memory and converted to Arrow format. All in-memory computations are based on Arrow data, there is no serialization overhead across processes or over networks.
Arrow Columnar format
The Arrow data format is column-based, which is especially convenient for Online Analytical Processing workloads (OLAP). Below, the pictures compare row-based versus column-based data formats.
![]()
On the left side, there is an example dataset. It contains three columns (fields), in three colors, "session_id", "timestamp" and "source_ip". And it contains four rows (records).
In the middle is the Row Buffer, showing the traditional row-based memory layout. Data is stored in row order. The colors are interleaved, which means data from same column is not contiguous in memory. Rows are contiguous.
The right side is the Column Buffer, showing the memory layout of column-based data format. The colors are contiguous. The same columns for all records are stored contiguously in memory.
The columnar format is fast for OLAP tasks. For example, we may want to do a simple aggregation on “source_ip” column to find which IP occurs most frequently. Assume there is no index on “source_ip”. In row-based layout, all the records must be loaded, but the “session_id” and “timestamp” are not used, they are discarded immediately after loaded. This causes a big waste of memory and CPU cycles. But with column-based layout, “source_ip” are stored contiguously in memory. We only need to scan this single buffer, the red block, which is much more efficient than row-based layout.
Another benefit of the columnar format is that it is SIMD-friendly as the values of the same type are packed together. For example, suppose we want to sum the "session_id", where it is an integer. With column base data, the compiler can easily vectorize the summation code.
The following images shows the details of Arrow fixed-size and variable-size list data formats. It illustrates how columnar data formats are implemented internally. Note that, Arrow implements many more data formats.
- Fixed-Size List
- Validity bitmap indicates if a slot contains valid value
- Value array holds all values contiguously, including missing values
![]()
- Variable-Size List
- Validity bitmap indicates if a slot contains a valid value
- Offset array calculates the slot offset and the length in value array
- Value array holds all values contiguously, skipping missing values
![]()
Arrow ecosystem
Arrow is already a mature project and is widely adopted in big data and data science fields. The Arrow community is very open with committers from many big technology companies, including Arm.
Apache Arrow supports almost all popular languages, such as C/C++, Java, Rust, Golang, Python, and so on. We focus on Arrow C++ and Golang modules performance optimization currently within Arm.
![]()
This picture shows internal components of Arrow C++ library.
The middle yellow box is the Arrow Columnar format. It defines the data structures and utilities. It is the core of the Arrow project.
Above the Arrow Columnar format is Compute Kernel and Flight RPC.
Arrow implements many useful computation kernels to do common analytic jobs on the Arrow data. For example, summation, counting, sorting.
Flight RPC helps to transfer Arrow Columnar data across networks, to applications running on other machines. It enables Arrow to achieve high-performance distributed computations, not only on a single host. Flight RPC can also be used for inter-process data transmission on the same host.
Under Arrow Columnar format is Arrow dataset modules (the blue box). Arrow Dataset converts various storage formats to Arrow Columnar format, such as CSV, JSON, Parquet. It provides an API to load on-disk files of these various formats to memory and convert them into Arrow Columnar format. The higher-level modules such as Compute kernels and Flight RPC can then manipulate the data.
Optimize Arrow CSV Parser with Top-down methodology
Test environment: Arm Neoverse-N1, Ubuntu 20.04 AArch64, Clang-12.
About Top-down analysis
Top-down analysis uses CPU PMU (Performance Monitoring Units) to help developers learn how an application is utilizing hardware resources and to identify the bottleneck.
The following image shows the basic idea. The analysis starts from evaluating the "Stall Slots" metrics, which indicate how efficiently we are using the CPU. At the second level, we want to know if the stalled slots are caused by "Front End" or "Back End". Then going down to third level to identify if the issue is from a memory stall or a CPU resource limitation such as renaming buffer, execution ports.
There are many PMU events and metrics that are useful for performance analysis.
- Cycle accounting
- Branch Effectiveness
- Cache Effectiveness
- TLB effectiveness
- Instruction Mix
![]()
About the Arrow CSV Parser
Arrow CSV Parser converts CSV data (row based) to Arrow data (column based), as the image shows:
- On the left side is the CSV data. Each row represents one record. Data in one row is contiguous in the memory.
- On the right side is the Arrow data. Fields of the same column are contiguous in the memory. For example, the three names (Mike, Peter, Jack) are packed in one large buffer "MikePeterJack", with an index array [0,4,9,13] to slice the individual names from that buffer.
![]()
We can imagine a simple implementation:
- Maintain a reader pointer from CSV data buffer and a writer pointer to Arrow output buffers.
- Repeat the following steps until end of CSV data:
- Read one char from CSV input buffer
- If it's a normal char (not a special token), we copy it to Arrow buffer
- Once we read a CSV field delimiter (e.g., the comma), we forward the writer pointer to the next Arrow buffer (next column)
- Once we read a newline from CSV buffer, we rewind writer pointer to the first Arrow buffer (next row)
Performance of this simple approach cannot be good as we must compare each input char against all special tokens (e.g., comma, newline) to determine the next step, there will be many branches.
There are five special tokens in Arrow CSV parser: field delimiter (normally a comma, configurable), escape (configurable), quote (configurable), return (\r), and newline (\n).
Understand Current Performance
Firstly, let us run the benchmark to see current performance.
Note: Benchmark iterations are manually fixed (to 80), so PMU events and performance metrics (for example, total instructions) from different runs are directly comparable. Otherwise, the test iterations may vary among different runs as Arrow uses google benchmark which determines benchmark iterations dynamically.
$ perf stat -e cycles,instructions -- original/arrow-csv-parser-benchmark --benchmark_filter=ParseCSVVehiclesExample
------------------------------------------------------------------------------------------------
Benchmark                                      Time             CPU   Iterations UserCounters...
------------------------------------------------------------------------------------------------
ParseCSVVehiclesExample/iterations:80   12298238 ns     12297825 ns           80 bytes_per_second=932.517M/s

 Performance counter stats for 'original/arrow-csv-parser-benchmark --benchmark_filter=ParseCSVVehiclesExample':

        3013221903      cycles
        9786619780      instructions              #    3.25  insn per cycle

       1.004706482 seconds time elapsed

       0.988807000 seconds user
       0.016013000 seconds sys
From the benchmark result:
- Arrow CSV parser processes a bit fewer than 1G bytes CSV data per second.
- The Instructions Per Cycle (IPC) is above 3, which is very good. It must have adopted some tricks to achieve this high IPC, and is unlikely to be employing the simple approach mentioned previously.
Profile with Top-down Methodology
Secondly, let us collect PMU events, calculate and plot the Top-down metrics for review.
- Level-1 Metrics
![]()
- Cache and TLB Effectiveness
![]()
![]()
- Instruction Mix
![]()
Top-down Metrics Analysis:
- Level1 graph shows most cycles are doing useful jobs, which matches the high IPC we observed.
- Cache, TLB and Branch effectiveness look good. MPKIs (Misses Per Kilo Instruction) and Miss Rates are low. No obvious issue found.
- DP (data processing) occupies about 2/3 of total instructions. A bit surprising as we would expect higher volumes of load/store and branch operations (at least for our simple CSV parser implementation). And high volumes of data processing often indicate opportunities to leverage SIMD to reduce computations.
Let us investigate the source code to see what is happening.
Deeper investigation: why high DP%?
It turns out the current Arrow code is already optimized to process input CSV chars in batch, instead of char-by-char handling.
Revisiting the task: to convert CSV row-based data to Arrow column-based format. The problem is that we must handle some special tokens (field separator, newline, and so on) differently than normal field chars, which force us to process input chars one by one. In real-world CSV data, special tokens are less frequent than normal chars. We can pre-check the data block in 4 or 8 bytes. If there is no special token in the block, it can be processed in batch to save time. The following image illustrates the idea.
![]()
For better performance, we want to check existence of special tokens in a data block efficiently.
SSE4.2 provides the pcmpistri instruction for this purpose. Neon does not have an equivalent instruction. On non-x86 platforms, Arrow implements a bloom filter to do quick scanning of the coming string block. Basically, it maps a char to 1 bit in a 64-bits mask to check if it matches a predefined token. The bloom filter does lots of integer shift, logical and arithmetic operations, which is the reason why there is high DP%.
Part of the bloom filter code is listed. We can see the integer operations in the following code.
  // A given character value will set/test one bit in the 64-bit filter,
  // whose bit number is taken from low bits of the character value.
  // ......
  FilterType CharFilter(uint8_t c) const {
    return static_cast<FilterType>(1) << (c & kCharMask);
  }

  FilterType MatchChar(uint8_t c) const { return CharFilter(c) & filter_; }
Note: Readers may argue that this pre-check and process in batch approach may hurt performance if there are many very short CSV fields. This is a real concern, and the Arrow CSV parser will check field sizes and adjust the best approach dynamically.
Optimize with Neon
Instead of a bloom filter, we can do better with Neon to check if there are any special token in 8 or 16 continuous chars efficiently.
The idea is simple, the scalar code illustrates how we check if a char matches any one of five tokens.
// scalar code for illustration
bool Matches(uint8_t c) {
  return (c == '\r') | (c == '\n’) | (c == delim_) | (c == quote_) | (c == escape_);
}
The following Neon vectorized code can check 8 chars at once.
// NEON vectorized code
bool Matches(uint8x8_t w) {
  v = vceq_u8(w, vdup_n_u8('\r'));
  v = vorr_u8(v, vceq_u8(w, vdup_n_u8('\n')));
  v = vorr_u8(v, vceq_u8(w, delim_));
  v = vorr_u8(v, vceq_u8(w, quote_));
  v = vorr_u8(v, vceq_u8(w, escape_));
  return (uint64_t)v != 0;
}
Let us benchmark the optimized code.
$ perf stat -e cycles,instructions -- optimized/arrow-csv-parser-benchmark --benchmark_filter=ParseCSVVehiclesExample
------------------------------------------------------------------------------------------------
Benchmark                                      Time             CPU   Iterations UserCounters...
------------------------------------------------------------------------------------------------
ParseCSVVehiclesExample/iterations:80    6603949 ns      6603767 ns           80 bytes_per_second=1.69587G/s

 Performance counter stats for 'optimized/arrow-csv-parser-benchmark --benchmark_filter=ParseCSVVehiclesExample':

        1650645888      cycles
        5031043322      instructions              #    3.05  insn per cycle

       0.550513646 seconds time elapsed

       0.534586000 seconds user
Big performance boost is observed from this Neon optimization:
- Throughput improves ~80%, from 932MB/s to 1.69GB/s
- Total instructions decrease ~50%, from 9.79E+9 to 5.03E+9
Now Let us replot the Instruction Mix metric.
![]()
Compared with Instruction Mix metric before optimization:
- DP% (Data Processing) drops half, from ~2/3 to ~1/3
- ASE% (SIMD) now occupies over 1/4 of total instructions
Summary
The original Arrow CSV parser performance was quite good. But with Top-down methodology, from the Instruction Mix graph, we see high volumes of integer processing instructions. It leads us to the finding of reducing total integer processing instructions by leveraging NEON technology. The optimized code improves about 80% throughput and cuts down half of the total instructions.
Of course, it is necessary to read through the source code and figure out how SIMD can help in this situation, which is still a hard task. But the Top-down methodology does help us to find the bottleneck quickly and focus on the performance critical code.
The upstream PR for reference: https://github.com/apache/arrow/pull/11896.
Optimize Arrow CSV writer with Arm SPE
Test environment: Arm Neoverse-N1, Ubuntu 20.04 AArch64, Clang-12.
About Arm SPE
Arm SPE (Statistical Profiling Extensions) is an optional feature of Armv8-A architecture (starts from v8.2), which provides hardware based statistical sampling for CPUs.
SPE supports load/store, branch, memory latency profiling and many other useful features.
SPE overcomes the skid issue of traditional profiling and can give the precise address of instructions causing problems. As this CSV writer example shows, SPE is very useful in profiling and optimizing real-world workloads.
About the Arrow CSV writer
Opposite to CSV parser, Arrow CSV writer converts Arrow columnar data to CSV data format, as the following image shows:
![]()
Understand current performance
Let us run the benchmark to get an overview of current performance.
Note: Benchmark iterations are manually fixed (to 2000), so PMU events and performance metrics from different runs are directly comparable.
$ perf stat -e instructions,cycles,BR_RETIRED,BR_MIS_PRED_RETIRED \
            -- original/arrow-csv-writer-benchmark --benchmark_filter=WriteCsvStringNoQuote/0
--------------------------------------------------------------------------------------------------
Benchmark                                        Time             CPU   Iterations UserCounters...
--------------------------------------------------------------------------------------------------
WriteCsvStringNoQuote/0/iterations:2000     279445 ns       279440 ns         2000 bytes_per_second=1.47342G/s null_percent=0

 Performance counter stats for 'original/arrow-csv-writer-benchmark --benchmark_filter=WriteCsvStringNoQuote/0':

        3783506612      instructions              #    2.22  insn per cycle
        1706928603      cycles
         849829756      BR_RETIRED
           3300804      BR_MIS_PRED_RETIRED

       0.569347591 seconds time elapsed

       0.561436000 seconds user
       0.008020000 seconds sys
From the benchmark result:
- 1.5GB ~ 1.8GB Arrow data are processed per second
- IPC > 2, looks good
- Over 20% of instructions are branches, might deserve a deeper look
Profile Branch with SPE
With SPE, it is easy to locate exactly the branches suffering from relatively high misprediction rate with Linux perf tool.
$ perf record -e arm_spe_0/branch_filter=1,jitter=1/ -o /tmp/perf.data \
              -- original/arrow-csv-writer-benchmark --benchmark_filter=WriteCsvStringNoQuote/0
$ perf report -i /tmp/perf.data --stdio
...... omitted ......
#
# Children      Self  Command          Shared Object                Symbol
# ........  ........  ...............  ...........................  ...............................................
#
    79.53%    79.53%  arrow-csv-write  libc-2.31.so                 [.] __GI___memcpy_simd
     4.45%     4.45%  arrow-csv-write  libc-2.31.so                 [.] __memchr_generic
     2.63%     2.63%  arrow-csv-write  libarrow.so.900.0.0          [.] arrow::compute::CallFunction
     1.67%     1.67%  arrow-csv-write  libarrow.so.900.0.0          [.] arrow::csv::(anonymous namespace)::QuotedColumnPopulator::UpdateRowLengths
     0.99%     0.99%  arrow-csv-write  ld-2.31.so                   [.] _dl_lookup_symbol_x
     0.93%     0.93%  arrow-csv-write  libarrow.so.900.0.0          [.] arrow::SimpleRecordBatch::Slice
     0.70%     0.70%  arrow-csv-write  libarrow.so.900.0.0          [.] je_arrow_private_je_edata_avail_remove
     0.70%     0.70%  arrow-csv-write  libc-2.31.so                 [.] _int_malloc
     0.64%     0.64%  arrow-csv-write  libarrow.so.900.0.0          [.] arrow::csv::(anonymous namespace)::ColumnPopulator::~ColumnPopulator
     0.54%     0.54%  arrow-csv-write  ld-2.31.so                   [.] do_lookup_x
...... omitted ......
From the previous report, memcpy from libc is at the top (79.53%).
To locate the mispredicted branch, we can use perf-annotate to investigate the assembly code of memcpy.
$ perf annotate -i /tmp/perf.data -s __GI___memcpy_simd --stdio
......omitted......
 Percent |	Source code & Disassembly of libc-2.31.so for branch-miss (9727 samples, percent: local period)
---------------------------------------------------------------------------------------------------------------
         :
         :
         :
         : 3     Disassembly of section .text:
         :
         : 5     0000000000085010 <explicit_bzero@@GLIBC_2.25+0x2a8>:
    0.00 :   85010:  add     x4, x1, x2
    0.00 :   85014:  add     x5, x0, x2
    0.00 :   85018:  cmp     x2, #0x80
    0.00 :   8501c:  b.hi    850e8 <explicit_bzero@@GLIBC_2.25+0x380>  // b.pmore
    0.00 :   85020:  cmp     x2, #0x20
    0.26 :   85024:  b.hi    850a0 <explicit_bzero@@GLIBC_2.25+0x338>  // b.pmore
    0.00 :   85028:  cmp     x2, #0x10
    0.83 :   8502c:  b.cc    85044 <explicit_bzero@@GLIBC_2.25+0x2dc>  // b.lo, b.ul, b.last
    0.00 :   85030:  ldr     q0, [x1]
    0.00 :   85034:  ldur    q1, [x4, #-16]
    0.00 :   85038:  str     q0, [x0]
    0.00 :   8503c:  stur    q1, [x5, #-16]
    0.00 :   85040:  ret
   97.28 :   85044:  tbz     w2, #3, 8505c <explicit_bzero@@GLIBC_2.25+0x2f4>
    0.00 :   85048:  ldr     x6, [x1]
    0.00 :   8504c:  ldur    x7, [x4, #-8]
    0.00 :   85050:  str     x6, [x0]
    0.00 :   85054:  stur    x7, [x5, #-8]
    0.10 :   85058:  ret
    1.47 :   8505c:  tbz     w2, #2, 85074 <explicit_bzero@@GLIBC_2.25+0x30c>
    0.00 :   85060:  ldr     w6, [x1]
    0.00 :   85064:  ldur    w8, [x4, #-4]
    0.00 :   85068:  str     w6, [x0]
    0.00 :   8506c:  stur    w8, [x5, #-4]
    0.00 :   85070:  ret
...... omitted ......
Though looks intimidating, the memcpy code is quite straightforward and deserves careful reading. The full source code can be found in the glibc library.
memcpy implements several subroutines optimized based on buffer size to be copied. The size boundaries are checked in order of 128,32,16,8,4.
From the annotated assembly code previous, we can see almost all misprediction (97.28%) comes from the opcode at address 85044 (line 24).
97.28 : 85044: tbz w2, #3, 8505c <explicit_bzero@@GLIBC_2.25+0x2f4>This instruction is to branch if the 3rd bit of register w2 (buffer size to be copied) is set. And if this instruction is reached, we know the buffer size must be less than 16. So, this instruction can be written in C as "if (size < 8) goto .L8505c;".
Looks like the CPU is struggling to determine if the buffer to be copied is shorter or longer than 8 bytes. Why?
Deeper investigation: why high misprediction in memcpy?
Revisiting the task: to convert Arrow column-based data to CSV row-based data. The Arrow CSV writer is continuously copying data fields from Arrow buffer to CSV buffer. After copying one field, it must append a delimiter (for example, comma) or end-of-line (last field). The following code illustrates the hot loop:
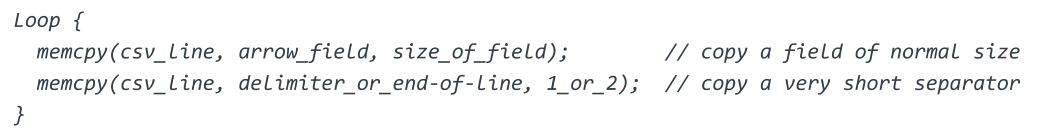
So, the CSV writer is calling memcpy with a data field (normal size) and a very short delimiter (1 byte or 2 bytes) repeatedly. This pattern makes it harder to train the CPU branch predictor. This is unfortunate as Arrow CSV writer populates fields in column order, and fields of the same column are often of similar size, which is friendly to predict. But the delimiter copying breaks this convenience.
You may wonder why use memcpy to append a delimiter. Cannot we simply write *buf++ = ',';? The reason is that the delimiter is configurable at run time and can be of any length in theory. Arrow code must be general enough to handle this condition. But, in practice, the delimiter, and end of line are almost always at most 2 characters long.
Optimize the Branch
Optimization is straightforward after understanding the root cause. We can define a trivial memcpy clone (copy_separator) only to copy delimiter and end of line, leave the libc memcpy for copying normal data fields.
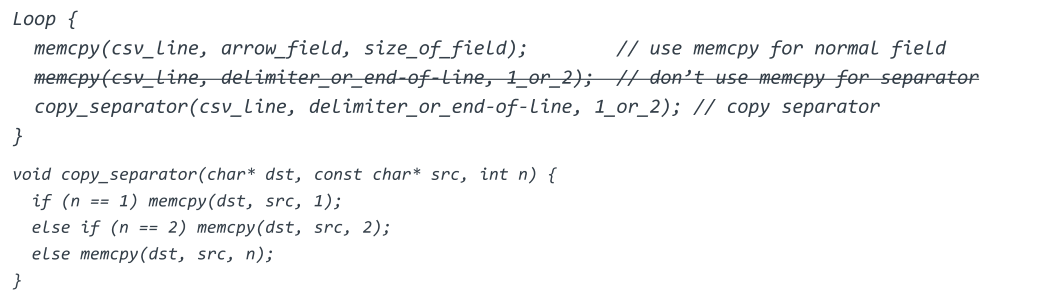
copy_separator might look strange at first sight as it still calls memcpy. It is not the case as compiler optimizes code like memcpy(dst, src, 1) to single load/store instructions when the buffer size is known at compile time. Only when delimiter is longer than two chars, which is rare in practice, the libc memcpy is called.
Let us benchmark the optimized code.
$ perf stat -e instructions,cycles,BR_RETIRED,BR_MIS_PRED_RETIRED \
            -- optimized/arrow-csv-writer-benchmark --benchmark_filter=WriteCsvStringNoQuote/0
--------------------------------------------------------------------------------------------------
Benchmark                                        Time             CPU   Iterations UserCounters...
--------------------------------------------------------------------------------------------------
WriteCsvStringNoQuote/0/iterations:2000     192238 ns       192233 ns         2000 bytes_per_second=2.14184G/s null_percent=0

 Performance counter stats for 'optimized/arrow-csv-writer-benchmark --benchmark_filter=WriteCsvStringNoQuote/0':

        3063222827      instructions              #    2.58  insn per cycle
        1186036951      cycles
         609796441      BR_RETIRED
           1507719      BR_MIS_PRED_RETIRED

       0.395666338 seconds time elapsed

       0.395778000 seconds user
       0.000000000 seconds sys
Comparing performance of the optimized code with the original one:
- Throughput improves from (1.5~1.8)GB/s to 2.1GB/s, with 20% to 40% uplift
- Total instructions drop from 3.78E+9 to 3.06E+9, branches drop from 8.50E+8 to 6.10E+8
Now let us redo the SPE profiling to see the difference against original code.
$ perf record -e arm_spe_0/branch_filter=1,jitter=1/ -o /tmp/perf.data \
              -- optimized/arrow-csv-writer-benchmark --benchmark_filter=WriteCsvStringNoQuote/0
$ perf annotate -i /tmp/perf.data -s __GI___memcpy_simd --stdio
......omitted......
 Percent |	Source code & Disassembly of libc-2.31.so for branch-miss (432 samples, percent: local period)
--------------------------------------------------------------------------------------------------------------
         :
         :
         :
         : 3     Disassembly of section .text:
         :
         : 5     0000000000085010 <explicit_bzero@@GLIBC_2.25+0x2a8>:
    0.00 :   85010:  add     x4, x1, x2
    0.00 :   85014:  add     x5, x0, x2
    0.00 :   85018:  cmp     x2, #0x80
    0.00 :   8501c:  b.hi    850e8 <explicit_bzero@@GLIBC_2.25+0x380>  // b.pmore
    0.00 :   85020:  cmp     x2, #0x20
    2.78 :   85024:  b.hi    850a0 <explicit_bzero@@GLIBC_2.25+0x338>  // b.pmore
    0.00 :   85028:  cmp     x2, #0x10
   90.51 :   8502c:  b.cc    85044 <explicit_bzero@@GLIBC_2.25+0x2dc>  // b.lo, b.ul, b.last
    0.00 :   85030:  ldr     q0, [x1]
    0.00 :   85034:  ldur    q1, [x4, #-16]
    0.00 :   85038:  str     q0, [x0]
    0.00 :   8503c:  stur    q1, [x5, #-16]
    0.00 :   85040:  ret
    2.55 :   85044:  tbz     w2, #3, 8505c <explicit_bzero@@GLIBC_2.25+0x2f4>
    0.00 :   85048:  ldr     x6, [x1]
    0.00 :   8504c:  ldur    x7, [x4, #-8]
    0.00 :   85050:  str     x6, [x0]
    0.00 :   85054:  stur    x7, [x5, #-8]
    0.46 :   85058:  ret
    3.47 :   8505c:  tbz     w2, #2, 85074 <explicit_bzero@@GLIBC_2.25+0x30c>
    0.00 :   85060:  ldr     w6, [x1]
    0.00 :   85064:  ldur    w8, [x4, #-4]
    0.00 :   85068:  str     w6, [x0]
    0.00 :   8506c:  stur    w8, [x5, #-4]
    0.00 :   85070:  ret
...... omitted ......
Interestingly, the top mispredicted branch moved from 85044 (line 26, comparing buffer size against 8) to 8502c (line 20, comparing buffer size against 16). This is expected as CSV fields in the test dataset varies in size around 16 bytes. And please note that the total branches have decreased significantly.
Full benchmarks show this optimization improves performance consistently over all test datasets with various size distributions.
How SPE helps this optimization
Without SPE, the skid issue of perf based on traditional PMU events makes it very hard to locate the code causing trouble.
Let us profile and annotate the original code without SPE.
$ perf record -e BR_MIS_PRED_RETIRED -o /tmp/perf.data \
              -- original/arrow-csv-writer-benchmark --benchmark_filter=WriteCsvStringNoQuote/0
$ perf annotate -i /tmp/perf.data -s __GI___memcpy_simd --stdio
......omitted......
 Percent |	Source code & Disassembly of libc-2.31.so for BR_MIS_PRED_RETIRED (1270 samples, percent: local period)
-----------------------------------------------------------------------------------------------------------------------
         :
         :
         :
         : 3     Disassembly of section .text:
         :
         : 5     0000000000085010 <explicit_bzero@@GLIBC_2.25+0x2a8>:
    4.42 :   85010:  add     x4, x1, x2
    0.00 :   85014:  add     x5, x0, x2
    1.29 :   85018:  cmp     x2, #0x80
    1.40 :   8501c:  b.hi    850e8 <explicit_bzero@@GLIBC_2.25+0x380>  // b.pmore
    7.53 :   85020:  cmp     x2, #0x20
    0.00 :   85024:  b.hi    850a0 <explicit_bzero@@GLIBC_2.25+0x338>  // b.pmore
    6.26 :   85028:  cmp     x2, #0x10
    0.00 :   8502c:  b.cc    85044 <explicit_bzero@@GLIBC_2.25+0x2dc>  // b.lo, b.ul, b.last
    2.39 :   85030:  ldr     q0, [x1]
   24.49 :   85034:  ldur    q1, [x4, #-16]
   11.00 :   85038:  str     q0, [x0]
    0.00 :   8503c:  stur    q1, [x5, #-16]
    0.00 :   85040:  ret
    0.79 :   85044:  tbz     w2, #3, 8505c <explicit_bzero@@GLIBC_2.25+0x2f4>
   13.41 :   85048:  ldr     x6, [x1]
    2.59 :   8504c:  ldur    x7, [x4, #-8]
    1.55 :   85050:  str     x6, [x0]
    0.00 :   85054:  stur    x7, [x5, #-8]
    0.55 :   85058:  ret
    0.66 :   8505c:  tbz     w2, #2, 85074 <explicit_bzero@@GLIBC_2.25+0x30c>
    0.00 :   85060:  ldr     w6, [x1]
    0.00 :   85064:  ldur    w8, [x4, #-4]
    0.00 :   85068:  str     w6, [x0]
    0.00 :   8506c:  stur    w8, [x5, #-4]
    0.00 :   85070:  ret
......omitted......
On contrary to the SPE profiling result, which clearly identifies 97% branch misses happen at 85044, the previous annotation (without SPE) suffers from severe skid issue. The tagged hot spots are scattered around many places and obviously wrong (most of them are not branch instructions at all).
Without SPE, we may still find the problematic branch by trial and error, but SPE makes the job much easier.
Summary
With the help of SPE, we identified a branch issue in the Arrow CSV writer, which leads to a simple refinement with considerable performance improvement.
Again, nothing can replace the challenging work of reading the source code (and assembly code). But SPE does help in quickly locating the culprit code and saves us much time in profiling.
The upstream PR for reference: https://github.com/apache/arrow/pull/13394.

By Yibo Cai
Re-use is only permitted for informational and non-commercial or personal use only.
