Using Perf to enable PMU functionality on Armv8-A CPUs: Stage 3 and Stage 4
Part 3. This blog introduces how to enable PMU feature in Armv8-A CPUs and provides an example of performance analysis workflow on real Armv8-A platform.
By Jiaming Guo

| Part 3 of 3 blog series |
In the Part 2, after collecting the performance statics from PMU, the reason for relatively high L2 data cache miss rate deserves more analysis. This part describes how to do hot-spot analysis and an optimization method with validation using Perf.
Stage 3: Sampling PMU events and conducting hot-spot analysis
To do hot-spot analysis, you must collect more detailed information. You can use Perf to sample PMU events to conduct hot-spot analysis.
Perf commands to use
perf record: Use this command to sample detailed performance data of a specified application over time. This command can help you identify performance bottlenecks or hotspots. This command samples data and stores it in a binary file namedperf.datain the same directory the command has been executed.perf report: This command can parse theperf.dataand generate profile.
How to use the perf record command
The basic usage of the perf record is as follows:
# Specify PMU event and sampling period
$ perf record -e <event> -c <count> -- <command to run the application>
# Specify PMU event and average sampling rate
$ perf record -e <event> -F <freq> -- <command to run the application>
# By default, cycles is selected with average sampling rate set to be 4000 samples/sec
$ perf record -- <command to run the application>
When using the command perf record, you can select PMU events to sample by using the -e option. Also, you can specify the sampling period by using the -c option or average sampling rate by using the -F option.
By default, perf record uses the event cycles and the sampling rate is set to 4000. For Armv8-A CPUs, the event cycles is mapped to the cycle counter.
The sampling period refers to the number of occurrences of the PMU event. For example, if you set -c 1000, a sample is recorded every 1000 occurrences of the selected PMU event.
The sampling rate refers to the average rate of samples per second. For example, if you set -F 1000, Perf records around 1000 samples per second. It is achieved by dynamically adjusting the sampling period by the kernel.
When using perf record to sample PMU events for hot-spot analysis, consider the following factors:
What sampling rate and period to set
For Armv8-A CPUs, the sampling is triggered by PMU overflow interrupt. This means that setting -c to a small number or setting -F to a large number introduces more interrupts while the application runs. Frequent interrupts can cause significant overhead.
Also, this interrupt-based recording method used in Perf will introduces skids. This means that some information, for example, the instruction pointer sampled is not the one where the counter counts. So, you need to carefully set the sampling rate/period that is appropriate for your application.
What events to select for sampling
The performance characteristics given by perf stat show that not all the events must be selected in perf record. You can choose a few of them to record and do hot-spot analysis. In this example, you can sample only l2d_cache_refill.
Example
An example to sample PMU events and do hot-spot analysis on the Juno r2 platform is as follows:
$ taskset -c 0-3 perf record -e armv8_pmuv3_0/l2d_cache_refill/ -F 999 -- 2D_array
[ perf record: Woken up 2 times to write data ]
[ perf record: Captured and wrote 0.316 MB perf.data (8265 samples) ]
First, use the command perf record to sample PMU event l2d_cache_refill. After the file perf.data is generated, use the command perf report for further hot-spot analysis. This command provides an interactive interface. A basic procedure to do hot-spot analysis is as follows:
1. Locate the function with most overhead
Use the command perf report as follows. By default reads the file named perf.data in the current directory.
$ perf reportIn this example, we select only one PMU event when using the command perf record. This shows when using the perf report, it shows recording information directly as follows. If more PMU events are recorded by perf record, perf report shows a pop-up an menu for you to choose which PMU event to analyze.
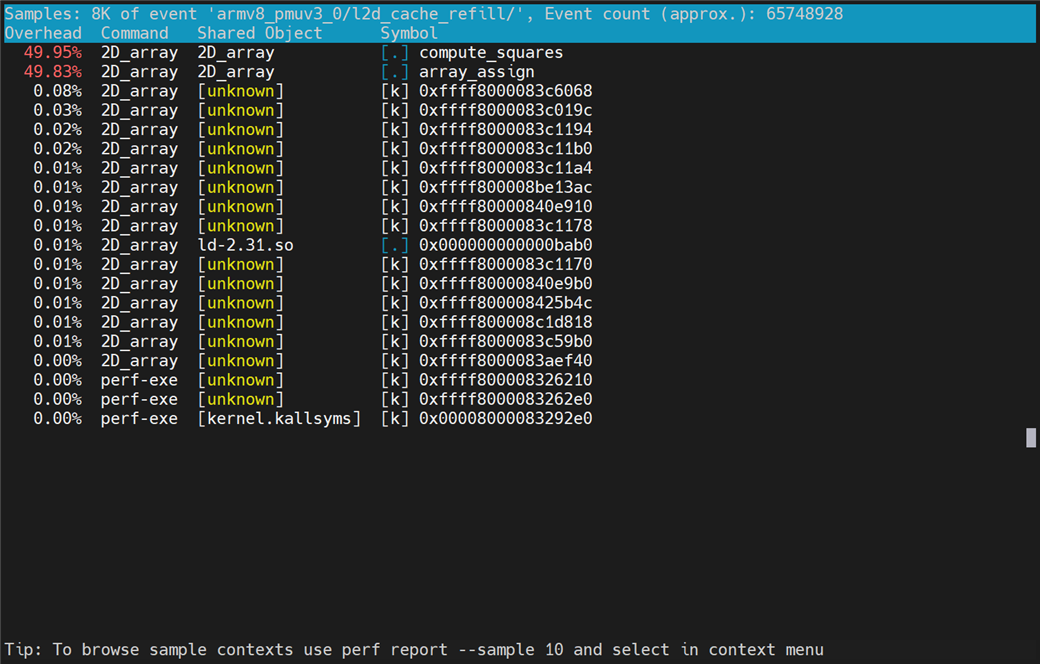
Figure 1: Overhead of PMU event samples per function
The above figure shows that the functions compute_squares and array_assign respectively take 49.95% and 49.83% of the overall samples of PMU event l2d_cache_refill. The [.] means that the samples are taken in the user-space.
2. Source analysis with Perf annotate
We can take a step further to analyze from source code. The interrupt-based recording introduces the skids. Therefore, Perf cannot provide the instructions where the PMU events are counted.
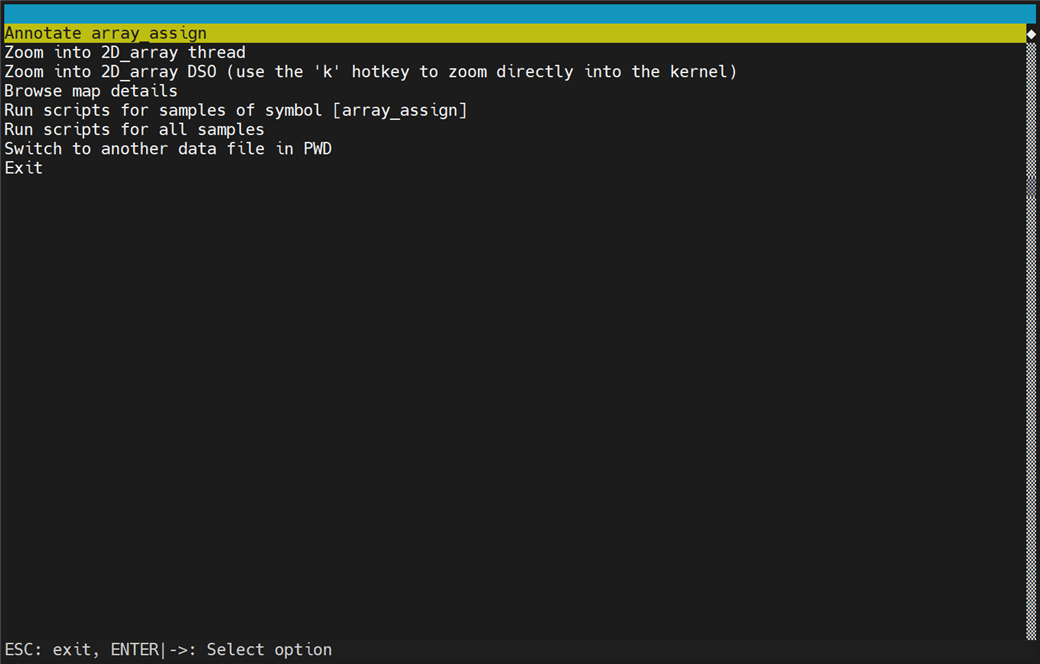
Figure 2: Menu for choosing operations for PMU event samples
We can locate the source code of function array_assign by selecting option Annotate array_assign, as shown in the following figure.
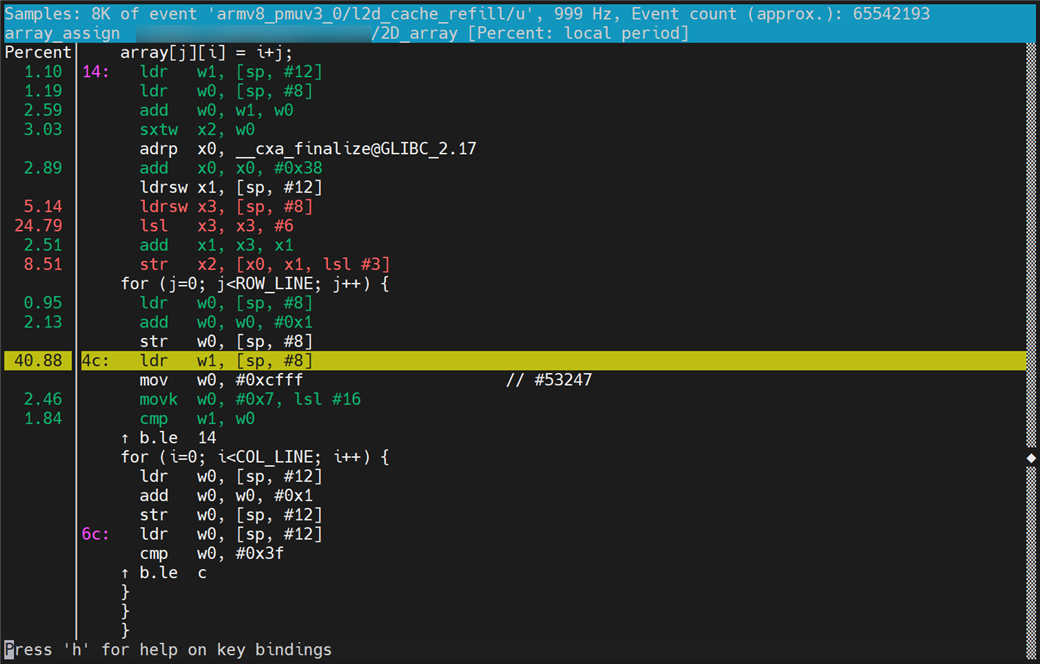
Figure 3: Hot-spot analysis through selected PMU event samples
The following figure shows that the percentage of the PMU event being sampled when the CPU executes the instruction on the right side is displayed on the left side of the separator vertical line. Based on the percentage data and the understanding of cache, we can speculate that the high L2 data cache miss rate is mainly caused by the approach of traversing a 2D array by column.
Stage 4: Optimizing code and performing validation
Perf commands to use
perf stat: The usage information of this command is already described in the section Stage 2: Collecting statistics from PMU of Part 2.perf diff: Command usage is the performance difference among twoperf.dataor more files captured throughperf record. It is useful for comparing the effect before and after optimization.
How to use the perf diff command
The basic usage of the perf diff is as follows:
# Specify perf.data path to compare
$ perf diff <path of old perf.data file> <path of new perf.data file>
# By default, compare the `perf.data` and `perf.data.old` in the current directory
$ perf diff
Example
Based on collected information, one possible optimization direction for the example application is as follows:
#define COL_LINE 64
#define ROW_LINE 512000

long array[ROW_LINE][COL_LINE];

void compute_squares()
{
    int i, j;

    for (i=0; i<COL_LINE; i++) {
        for (j=0; j<ROW_LINE; j++) {
            array[j][i] = array[j][i] * array[j][i];
        }
    }
}

void array_assign()
{
    int i, j;
    /* [M] Traverse by row */
    for (i=0; i<ROW_LINE; i++) {
        for (j=0; j<COL_LINE; j++) {
            array[i][j] = i+j;
        }
    }
}

int main()
{
    array_assign();
    compute_squares();
    return 0;
}
We modify the approach of traversing the 2D array from column traversal to row traversal. Using the cache-friendly traversal method, it is expected to result in a reduction in L2 data cache misses which will improve the performance of the application.
Compile the modified example application and run perf stat again to get key performance metrics as follows:
$ gcc -O0 -g 2D_array.c -o 2D_array
$ taskset -c 0-3 perf stat -e armv8_pmuv3_0/cpu_cycles/,armv8_pmuv3_0/inst_retired/,armv8_pmuv3_0/l1d_cache_refill/,armv8_pmuv3_0/l1d_cache/,armv8_pmuv3_0/l2d_cache_refill/,armv8_pmuv3_0/l2d_cache/,armv8_pmuv3_0/mem_access/ -- 2D_array

 Performance counter stats for '2D_array':

     5,387,230,517      armv8_pmuv3_0/cpu_cycles/
     1,599,412,481      armv8_pmuv3_0/inst_retired/
        34,576,836      armv8_pmuv3_0/l1d_cache_refill/
       697,922,349      armv8_pmuv3_0/l1d_cache/
        37,191,464      armv8_pmuv3_0/l2d_cache_refill/
        85,987,007      armv8_pmuv3_0/l2d_cache/
       665,282,669      armv8_pmuv3_0/mem_access/

       7.699647601 seconds time elapsed

       7.575061000 seconds user
       0.124050000 seconds sys
After the perf stat, you can compare the PMU event values and related metrics manually. The result is as follows:
| Item | Before optimization | After optimization |
| l2d_cache_refill | 65,775,517 | 37,191,464 |
| l2d_cache | 143,130,513 | 85,987,007 |
| Attributable Level 2 unified cache refill rate | 0.460 | 0.433 |
| l1d_cache_refill | 67,051,466 | 34,576,836 |
| l1d_cache | 695,606,934 | 697,922,349 |
| Attributable Level 1 unified cache refill rate | 0.095 | 0.050 |
| Execution time | 8.269886818 | 7.699647601 |
The results in the above table show that the optimization causes only a small decrease in L2 cache miss rate. However, you can observe a significant decrease in L1 data cache miss rate. This leads to reduced L2 cache accesses and faster execution time.
We may need to confirm if the modification of the code results in the optimization. Run the perf record again with the same parameters. After that, use perf diff to compare the effect of the optimization. A reduction in L2 data cache misses in the function array_assign is expected.
$ taskset -c 0-3 ./perf record -e armv8_pmuv3_0/l2d_cache_refill/ -F 999 -- 2D_array
[ perf record: Woken up 2 times to write data ]
[ perf record: Captured and wrote 0.301 MB perf.data (7690 samples) ]

$ perf diff
# Event 'armv8_pmuv3_0/l2d_cache_refill/'
#
# Baseline  Delta Abs  Shared Object      Symbol
# ........  .........  .................  ......................
#
    49.83%    -38.83%  2D_array           [.] array_assign
    49.95%    +38.29%  2D_array           [.] compute_squares
     0.22%     +0.54%  [unknown]          [k] 0xffff800008326210
     0.01%     +0.01%  ld-2.31.so         [.] 0x000000000000bab0
     0.00%     +0.00%  [kernel.kallsyms]  [k] 0x00008000083292e0
The perf record for the optimized application is run in the same directory as last time. In this case, Perf renames the perf.data to perf.data.old, and stores the latest recording samples into perf.data.
The event sampling results in the perf.data.old are treated as Baseline. We can see the changes because of the optimization from the column Delta Abs. Consider the PMU event l2d_cache_refill as an example. Before the optimization, 49.83% of the sampled L2 data cache misses events are from the function array_assign. After optimization, however, the value is reduced to 10.00%. Now, we can be sure that the optimization direction is effective.

By Jiaming Guo
Re-use is only permitted for informational and non-commercial or personal use only.
