Building better embedded debugging together
Explore how Arm and CDT Cloud advance embedded debugging in VS Code using open ecosystems, shared tools, and community-driven innovation
Modern embedded software development increasingly happens in Visual Studio Code. Visual Studio Code started as a lightweight editor . It is now the main front end for complex, professional-grade workflows, including deeply embedded C and C++ development. At Arm, this shift has shaped how we think about developer tools. We do not treat them as monolithic IDEs. We build composable systems built on shared infrastructure and open collaboration.
One collaboration that has been very productive is our work with the Eclipse CDT Cloud project. This partnership has played a key role in shaping the Arm CMSIS Debugger extension for VS Code. It is a good example of how open-source communities and commercial tool vendors can work together to deliver better outcomes for developers.
Modern foundations for C/C++ tooling
The Eclipse CDT Cloud initiative focuses on modern developer workflows. It provides high-quality, reusable components for C/C++ development in cloud-based and desktop environments.
Embedded developers need debugging, memory inspection, and peripheral visibility. These features are often tied to specific tools or vendors. CDT Cloud takes a different approach. It provides clean, well-architected extensions that expose these capabilities in a reusable and extensible way through the VS Code extension API.
Reuse by design
The Arm CMSIS Debugger extension provides a consistent debugging experience across a wide range of Cortex-M–based devices and toolchains. We build on proven components from the ecosystem instead of reimplementing low-level debugger infrastructure.
The CDT GDB Adapter is at the core of this integration. It provides a robust and extensible Debug Adapter Protocol (DAP) implementation for many GDB servers, such as pyOCD. It manages process control, breakpoints, stack inspection, and debug symbols.
CMSIS Debugger uses this adapter to focus on Arm and CMSIS-specific value. This includes standardized debug configuration, SCVD-based software component views, and device-centric workflows. It also uses a mature and actively maintained GDB backend.
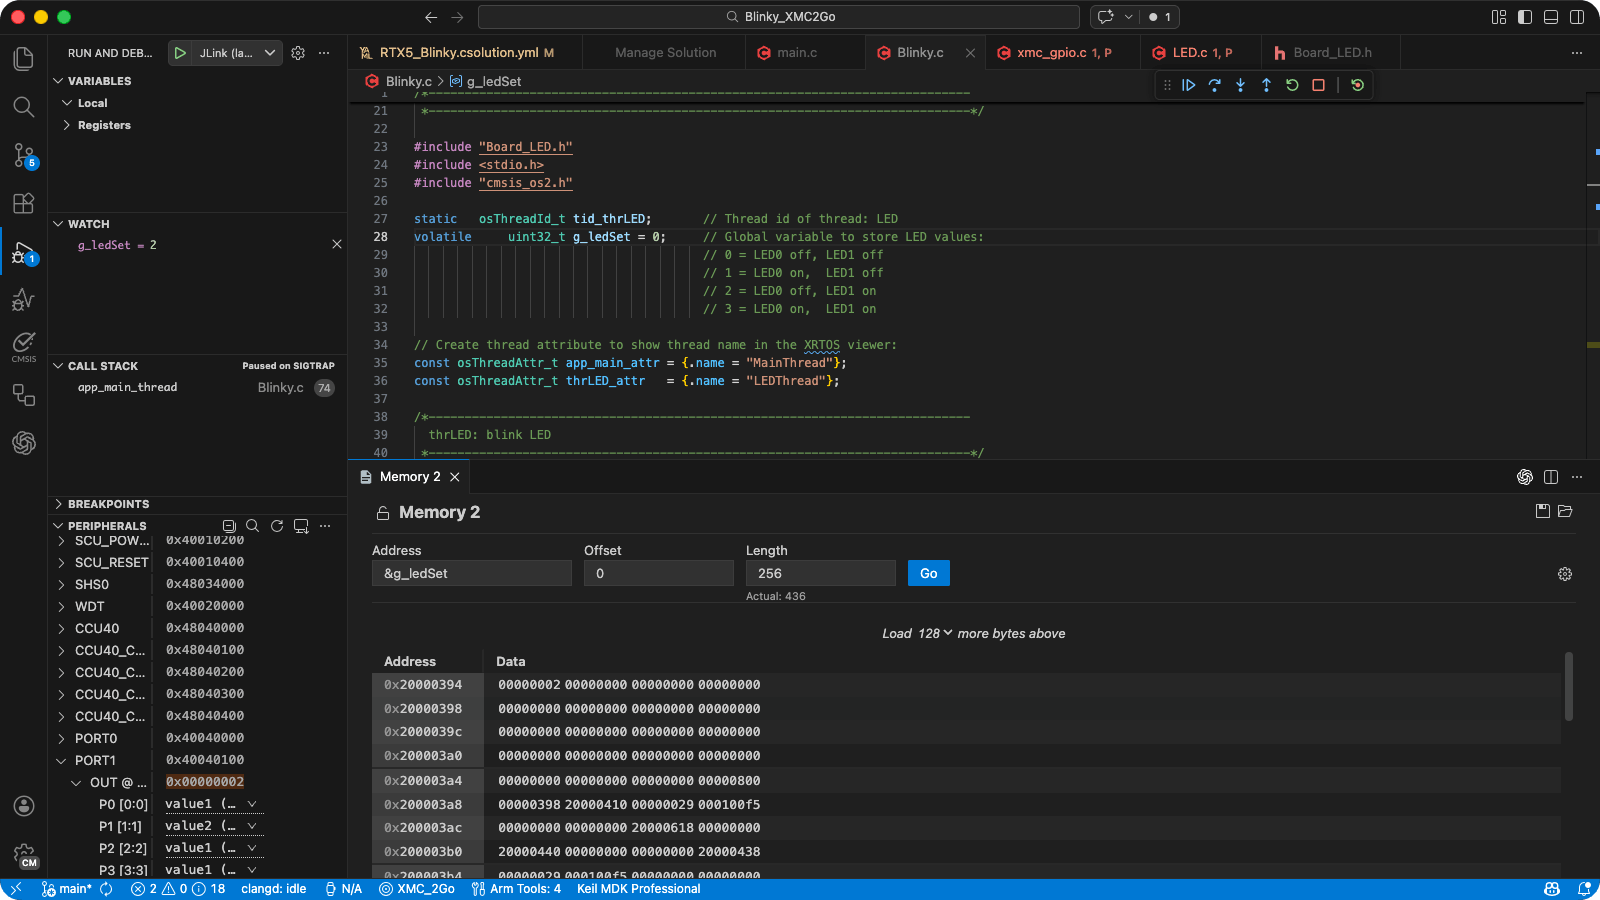
We also integrate the CDT Cloud Memory Inspector and Peripheral Inspector extensions. These tools turn what is traditionally a low-level, error-prone debugging task into something far more productive. Developers can inspect memory in structured views, apply type information, and map raw values to meaningful representations. CMSIS-SVD descriptions drive peripheral inspection. Developers can explore registers and bitfields directly within the IDE without resorting to external tools or manual decoding.
Why this matters to embedded developers
For developers, this collaboration results in a better daily experience. Developers no longer use fragmented tools with overlapping functionality and inconsistent behavior. They get a coherent debugging environment that feels native to VS Code while remaining aware of embedded hardware realities.
Sustainability is equally important. We build on open, community-driven components to reduce duplicated effort and help critical infrastructure evolve. Bug fixes, protocol updates, and new features help multiple toolchains and vendors at the same times. They are not locked into proprietary silos.
For teams working across different targets or mixing open-source and commercial tools, this approach also improves interoperability. Teams can reuse and extend the same debugger and inspection tools. This reduces surprises and lowers the barrier to adoption.
What we learned from the collaboration
Successful code reuse depends on shared software architecture, clear extension points, and open communication. Regular discussions on debugging, protocols, and user experience create alignment instead of loose integration. Arm uses shared CDT Cloud components. CDT Cloud receives valuable feedback from Arm and its partners.
The collaboration creates consistent and sustainable solutions. It ensures features such as hardware breakpoints work uniformly across the tool stack. This joint approach builds a strong foundation for embedded debugging. It also adds long-term strategic value to the partnership.
Looking ahead
Arm remains committed to open ecosystems and collaboration as part of our developer tools strategy. The work with Eclipse CDT Cloud continues. We see opportunities to improve embedded debugging by building on shared foundations instead of reinventing them.
We warmly invite developers to explore the Eclipse CDT Cloud and Arm CMSIS Debugger projects. Our communities are truly open and welcoming! Everyone is encouraged to join, participate, and contribute regardless of experience level. Developers can engage through regular community calls, active mailing lists, and lively GitHub discussions. These channels provide spaces to connect, ask questions, share ideas, and shape the future of embedded tooling together. Whether you are new or experienced, your voice and feedback matters. Embedded software development progresses faster when we build it together. Take the first step and get involved!

Re-use is only permitted for informational and non-commercial or personal use only.
