Finding (and fixing) hidden performance problems in mobile games with Arm Performance Studio
Learn how to find and fix hidden graphics performance problems in mobile games using Arm Performance Studio.
By John French

In March, Arm attended GDC 2026, where we hosted a full day of talks and demonstrations at our developer summit. The sessions covered neural graphics, emerging technology, and the future of mobile gaming.
Sumo Digital joined us, to discuss Project Buzz, now known as Neural Dawn. This technical collaboration showcases our neural graphics technology in a production-quality game. Infold Games also showed how they developed real-time global illumination in Love and Deepspace.
Both presentations showed how recent advances in graphics technology enable console-quality visuals on mobile devices.
So why was I there talking about basic mobile performance problems on old phones?
- Watch the talk: Hidden Performance Problems in Mobile Games
Arm makes profiling tools for games?
Usually, when we talk to developers about our profiling and analysis tools, one of the first things we hear is that they did not even know they existed.
Which is understandable.
After all, if you are using a game engine such as Unity or Unreal, the built-in profiling tools are convenient and effective for understanding how well your game is running.
So why do we make profiling tools?
Well, let us say you are making an Android game in Unity.
Unity is well optimized by default, and modern phones can be very fast. In fact, it can be difficult to reproduce performance problems on high-end devices.
But, if you want your game to run well for most players, they are unlikely to have the newest device. They are more likely to be using a phone they bought a few years ago and plan to keep for a few years more.
As a result, developers we talk to tell us that the minimum device they target is typically 6 years old. That already represents a significant performance challenge for visually demanding games.
However, the device’s age is not the only challenge. Android performance varies significantly between high-end and low-end devices. Making sure your game runs well across a wide range of phones and tablets that are up to 6 years old can be harder than you might think.
Which is why profiling your game, particularly on real hardware, is so important.
Fortunately, Unity makes this straightforward. You just need to find an older phone, build your project, load it onto your device, connect it to the profiler, and...
It is slow.

But Unity does not know why.
Why not?
Application profiling vs hardware profiling
In Unity, and in most other game engines, it is relatively easy to see what your game is doing by using the built-in profiling tools. You can see which functions it calls and how long they take to execute.
This is the application side and if you want to understand what the application is doing, the editor's profiling tools should be your first port of call.
But if your game is slow because GPU time is too high, there is not much that Unity can tell you.
It knows what it asked the GPU to do but, if it took a long time, it does not necessarily know why.
This is the hardware side and it is at this point that our tools, along with the equivalent profiling tools from other vendors, can be useful for measuring what a GPU is spending its time doing.
That is why we make them: to help mobile game developers understand what Arm hardware is actually doing when it runs their game.
However, simply seeing GPU data is usually not enough. There is a lot of information to be worked through and if you do not know what you are looking at, or what you are looking for, it can be difficult to use that data in a meaningful way.
That is why I went to GDC: to show mobile developers the kinds of performance problems that could appear in their games, how to find them using our tools, and how to fix them in Unity.
Diagnosing mobile graphics performance problems
Mobile GPUs work differently from most desktop and console GPUs.
They do not just have less processing power, they also use a different rendering pipeline to process visuals, so their strengths and weaknesses are different.
So how are they different, and why does that matter?
How mobile GPUs are different
A GPU rendering pipeline generally has 2 stages. The geometry stage processes vertex data into primitive shapes and the fragment stage rasterizes those shapes into the pixels on the screen.
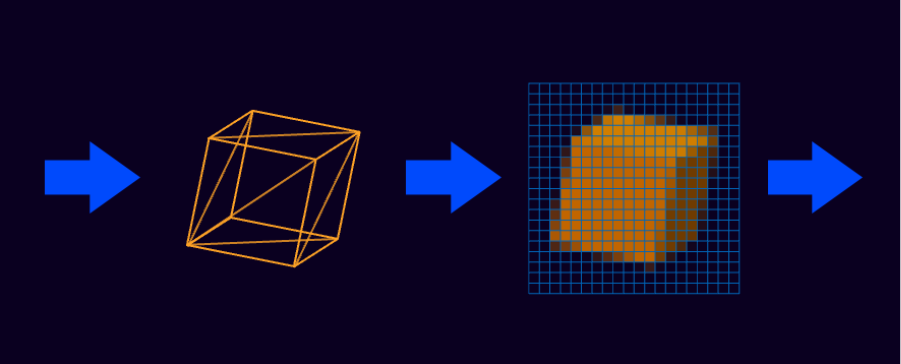
This is a simplified representation of the rendering pipeline, but it is how most GPUs, including mobile GPUs, work. Vertex shading processes geometry, followed by fragment shading that determines the color of each pixel.
However, although the basic pipeline remains the same, mobile GPUs handle it differently because they are designed for different performance objectives.
So how are they different?
A desktop GPU is usually physically separate from the other components in the system and actively cooled. That means it can use much more power to run as fast as possible while dissipating the heat that power creates, relatively easily.
In a phone, however, nothing runs at maximum.
Mobile devices are limited by how much heat they can dissipate passively, typically around 3 to 6 W.
That means the performance objective of a mobile device is not ”run as fast as you can.” Instead, it is “avoid doing things that generate heat.”
Heat is a byproduct of power consumption, and one of the most power-hungry things a mobile GPU can do is access RAM.
If your frame buffers, so the image data that calculates depth, color, and shadows, are the size of the screen, they are going to be too large to keep in the GPU cache on the chip. That means they have to be stored in RAM instead.
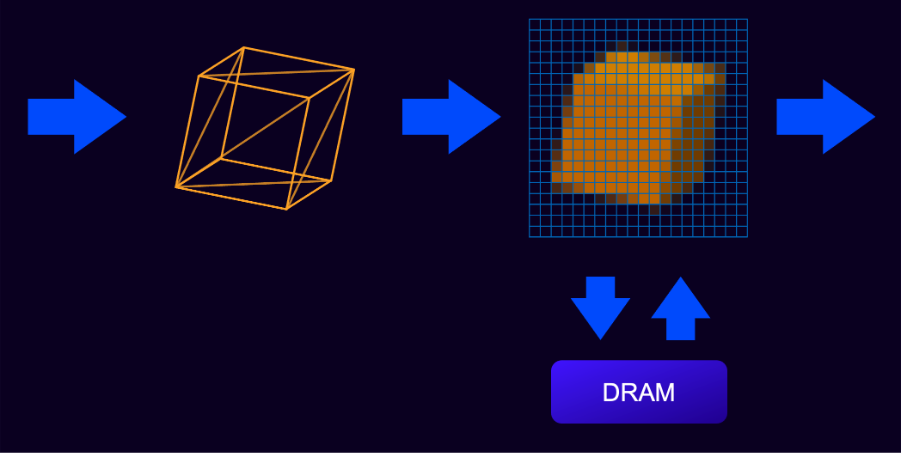
This is normal, and it is how many GPUs work, however it is not ideal for phones, which typically need to process a large number of pixels.
That is why mobile GPUs typically use a tile-based render pipeline instead. It divides the screen into small tiles, so the buffers are small enough to be kept in an on-chip cache instead of RAM.
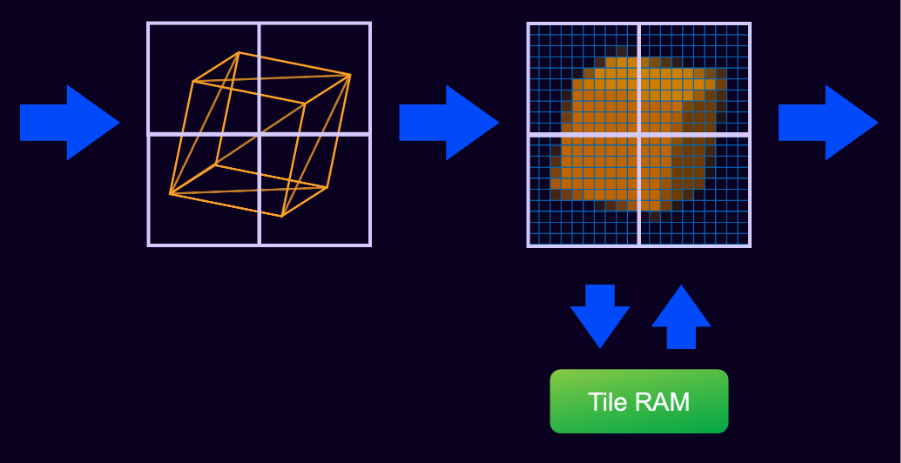
This avoids the high memory bandwidth cost of fragment shading, and it works.
But, there is a trade-off.
Mobile GPU weaknesses
Tile-based renderers avoid the cost of fragment processing by splitting the screen into many small tiles, typically 16 or 32 pixels wide.
However, before it can do that, the GPU needs to know which triangles contribute to which tiles. It does this in a process called binning, which adds extra processing overhead, both in GPU cycles and memory bandwidth.
This is because the output of the geometry stage, which contains a full screen’s worth of triangles, is too large to fit in on-chip memory, so it is stored in RAM instead.
This is one reason mobile GPUs can be sensitive to large amounts of geometry. It is also why dropping desktop-quality assets into a mobile game and then “turning down the graphics” usually does not work as you might expect.
At the other end of the pipeline, fragment shading still needs to be as efficient as possible to avoid fill-rate bottlenecks. Fill rate is the GPU’s raw pixel rendering performance and determines how quickly it can process and color pixels.
This is especially true on older and lower-end devices, which may have fewer shader cores, lower clock speeds, and a smaller overall cycle budget. One of the most common causes of fill-rate issues is overdraw, which happens when the GPU performs more work than necessary to produce each pixel.
These are some of the most common performance issues that can slow a mobile game and cause the GPU to spend too much time rendering each frame.
But how do you know if you have one of these problems?
For example, if you suspect you have an issue with geometry, or overdraw, how do you check?
Arm Performance Studio
Arm Performance Studio is our suite of free profiling and analysis tools for mobile games running on Arm hardware.
It includes:
- Frame Advisor, for frame construction analysis
- Streamline, our sample-based profiler
- RenderDoc for Arm GPUs, an Arm-specific fork of the open-source RenderDoc API debugger
- Mali Offline Compiler, a static analysis tool that is used to profile shader performance
The 2 tools I use the most often, and the ones I covered in my talk, are Frame Advisor, which works similarly to Unity's Frame Debugger, and Streamline.
Even if you use Unity, Frame Advisor can be useful for understanding what is happening in the rendering pipeline. While researching this talk, I found that Unity’s Frame Debugger is great for highlighting what each render pass does, however, Frame Advisor was sometimes better at showing the actual output of each rendering stage.
As a result, many of the images of depth tests, shadow maps, and post-processing passes in my talk came directly from Frame Advisor.
Streamline records samples at timed intervals, making it useful for understanding what the GPU spends its time over the course of a frame.
In this case, where GPU time is too high but we do not know why, that is exactly what we want.
However, if you are new to Streamline, the results might seem a little intimidating at first.
So what can you expect from a Streamline capture?
Take this frame, for example. It comes from the demo we built for GDC to showcase how our tools can help find and fix performance problems.
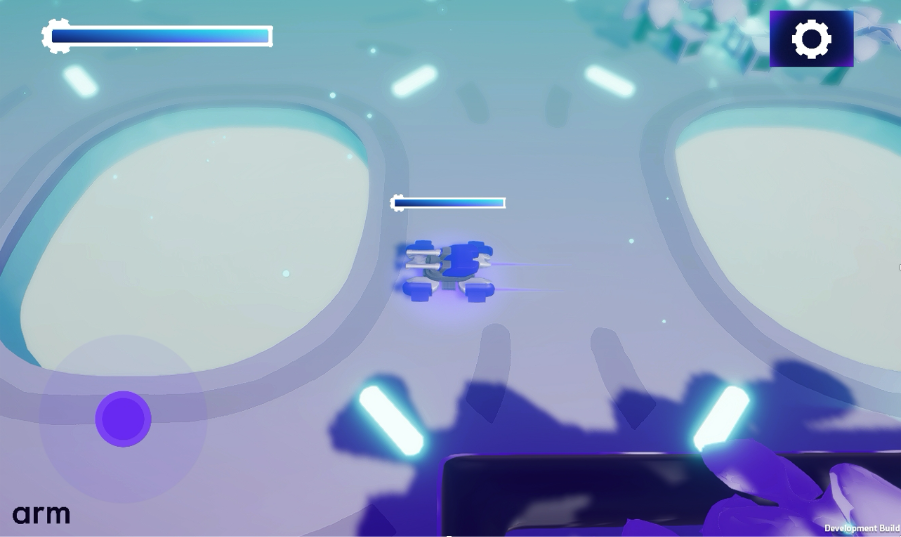
This frame, running on a low-power tablet, took about 50 ms to render, which is pretty slow.
Because the long frame time was caused by the GPU (the CPU time was around 12 ms), the logical next step is to profile the GPU to see what is taking so long. In this case I used Streamline.
After capturing the frame, the results look like this:
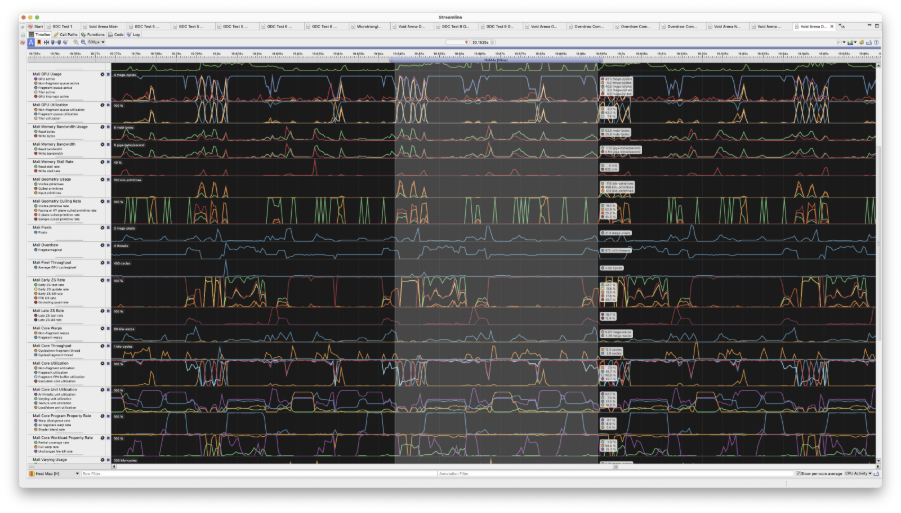
It can be a bit overwhelming, at least at first.
Once you know what you’ ae looking at, it quickly becomes a very useful tool.
How to use Streamline to diagnose performance problems
Streamline provides a huge amount of information about what a mobile GPU is doing, and you usually will not need all of it. However, if you zoom in and look at the data at the frame level, it starts to make much more sense.
When you zoom in, you can see the geometry and fragment workloads of the rendering pipeline in action.
For example, in this demo, you can see the non-fragment queue (orange) and the fragment queue (blue) alternating throughout the frame.

This is the Mali GPU Usage counter one of many data points available in Streamline. In this case, it shows the GPU’s main workloads throughout the frame.
This is the rendering pipeline in action and typically, you will see 1 or more geometry workloads, each followed by fragment workloads.
Here, you can see 3 spikes of non-fragment work at the start of the frame. The first 2 generate shadow maps: one for the main light and one for additional real-time lights.
If you switch to Frame Advisor, you can see the shadow maps generated by each pass.


Next, the scene’s opaque geometry is rendered. In the Mali GPU Usage chart, this appears as a geometry spike followed by a large block of fragment processing that colors the pixels.

At this point, most of the scene has been rendered and colored.
For the rest of the frame, the Mali GPU usage chart shows smaller geometry workloads for transparent objects and the UI. The UI is rendered on top of the main scene once the image has been constructed.
It is interesting to see your game’s workload broken down into sections of vertex and fragment processing.
At a glance, it looks like the GPU spends much more time being spent on fragment processing than on geometry.
That can be perfectly normal.
In fact, you usually have to go to extremes before your GPU workload becomes obviously vertex-heavy.
But just because your geometry workload looks ok at a glance does no’t mean that it is efficient.
So how can you tell?
Which data points should you look at if you suspect that there is too much geometry in your game?
How to tell if there is too much geometry in your mobile game
When testing your game on an Arm GPU, several GPU counters can help you determine whether your project is processing too much geometry.
For example, on a low-end device, geometry-heavy workloads are more likely to create measurable bottlenecks in the rendering pipeline.
One way to identify these bottlenecks is with the FPK Buffer Utilization counter in Streamline.
FPK is a bit of a misnomer. I It stands for Forward Pixel Kill, an Arm optimization that prevents fragment shading when a fragment is hidden behind another object.
However, it can also help measure the efficiency of the rendering pipeline.
Under normal conditions, the FPK buffer would normally be full or it would at least be highly utilized.
If, it is heavily underutilized, that can indicate a geometry bottleneck. In that case, fragments are being rasterized and shaded faster than geometry can be processed and binned.

There are other reasons the FPK buffer might be empty, such as if the screen is mostly empty space. However, if you suspect that too much geometry is slowing your game down, the FPK buffer can be a useful way to double-check.
But what if you are not testing on a lower-end device?
What if your game runs well on your device, but you are worried that other phones or tablets might struggle?
Another option is to check the Sample Culling Rate.
The Sample Culling Rate measures the percentage of triangles that are culled early in the rendering process because they are too small to be visible.

This is already wasteful because the GPU processes triangles only to discard them. It can also indicate that the geometry visible in the frame is too complex.
At this point, it is important to note that the Sample Culling Rate is not a direct measure of how efficiently the rendering pipeline handles your game’s geometry.
It is possible for this value to be low and still have too many triangles. It is also possible for it to be high but have few enough triangles that performance is not affected.
So why is it important?
A high Sample Culling Rate is often an indicator of micro triangles,. These are small triangles that cover only a handful of pixels and are typically caused by overly dense, complex geometry.
Micro triangles are inefficient on most GPU, but they are especially costly on mobile GPUs. Each additional triangle still incurs the overhead of binning, yet contributes only a few pixels to the final image.
Worse still, micro triangles do not just increase the geometry workload, they also make fragment processing less efficient because of overdraw.
Overdraw in mobile GPUs
Overdraw is the general term for doing more work than is necessary to color each pixel.
For example, the tablet that I used for most of my GDC testing has a resolution of 1340 x 800 pixels. At native resolution, it needs to color around 1 million pixels to render each frame.
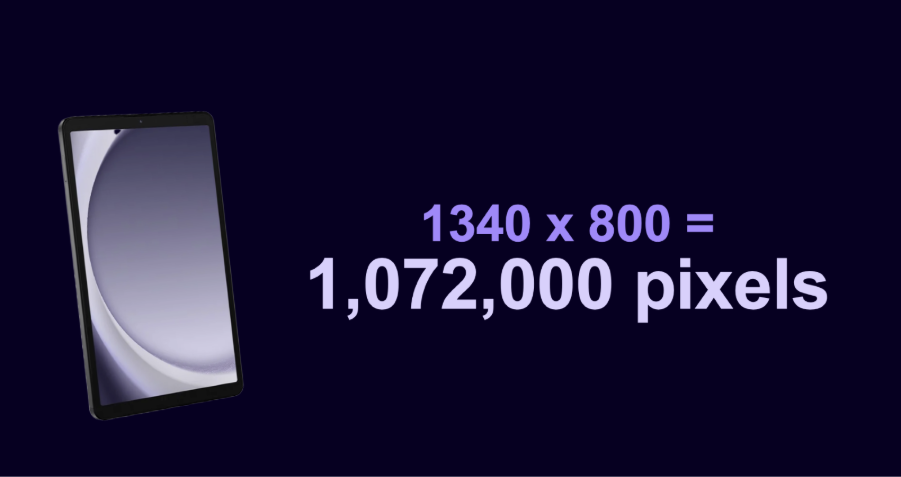
In an empty scene, with nothing else going on, that is what you will see in Streamline.

In practice, the total output of pixels processed during a frame is higher than this because the frame is usually rendered across multiple render passes.
However, while the total number of pixels is important, the amount of work required to color each of them in that, can lead to exponential performance problems.
This is overdraw, and it is typically expressed as a ratio of output pixels to fragment threads.
Ideally, the ratio of fragment threads to output pixels would be 1:1,so 1 invocation of the 1 fragment shader to work out what color each of those pixels should be.
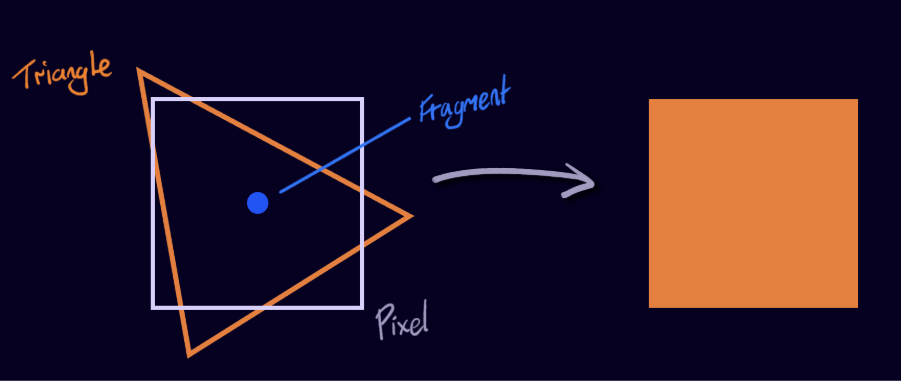
Overdraw happens when it takes more than 1 fragment thread to color a pixel, resulting in more work for the same final output.
In Streamline, overdraw is measured as the average number of fragment threads used to color each output pixel on screen.

While a 1:1 ratio is ideal, elevated values are common.
However, a significantly higher overdraw value means the GPU is doing much more work to color each pixel.
Sometimes this is intentional.
For example, multisample anti-aliasing (MSAA) uses multiple fragment samples to determine a pixel’s final color.
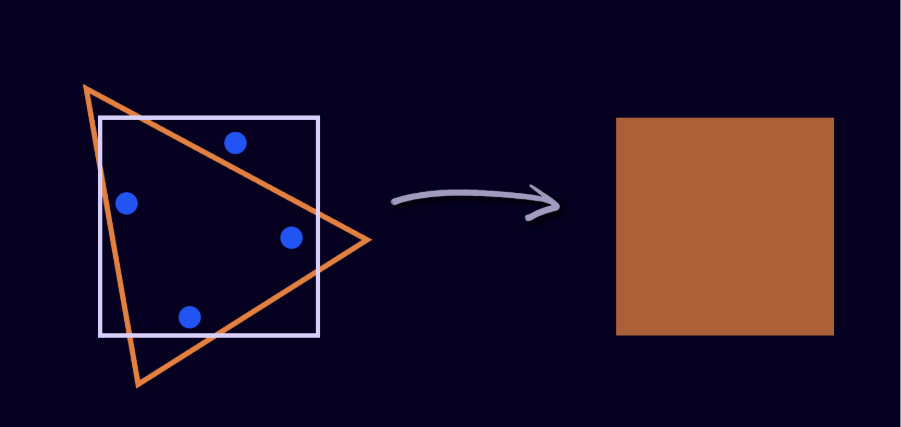
This is a deliberate trade off: more processing for a better-quality image.
However, other graphics workloads can also cause overdraw, and those are usually best avoided.
For example, transparency typically causes overdraw because objects behind a transparent material must be rendered first, so their colors can be blended with the transparent surface in front of them.
Likewise, cutout shaders, which discard pixels below a defined transparency threshold, can also cause overdraw because the shader does not know whether a fragment will be visible until it has processed it.
Micro triangles can also cause excessive fragment shading because of quad overdraw. A large number of very small primitives increases the amount of fragment work the GPU has to perform.
What is quad overdraw?
Quad overdraw measures how many 2 x 2 pixel blocks, known as quads, are only partially filled during fragment shading.
Pixels are rendered in quads so the GPU can calculate the derivatives needed to select the correct mipmap level for a texture.
A fully utilized quad shades all 4 pixels, while a partial quad shades fewer.
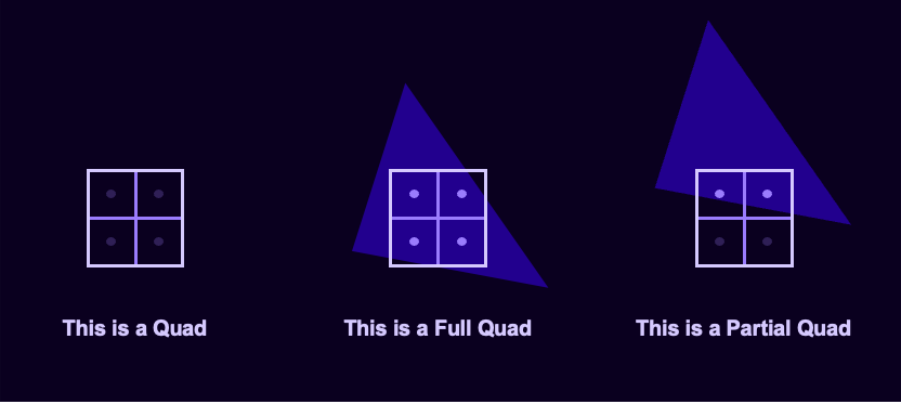
This happens when a triangle covers only some of the sample points in a quad.
From a performance perspective, this means the pixels that were not shaded in this quad were either processed earlier or will be processed later when another triangle is rasterized in the same area.
As a result, it can take the equivalent of 2, 3 or more, quads to color all 4 pixels, increasing overdraw.
You will typically see partial quads along triangle edges, and some of them are unavoidable. However, some geometry patterns are much more wasteful than others.
For example, we worked with developers whose application performed poorly because it drew a circle using a triangle fan. The dense convergence of thin triangles significantly increased quad overdraw.
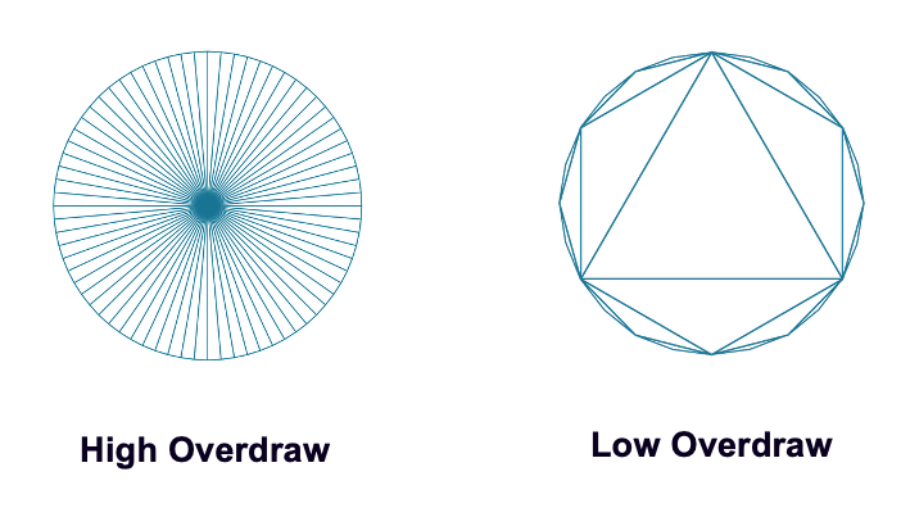
Micro triangles increase overdraw because they cover only a small area. As a result, rasterizing them produces a higher proportion of partial quads than fully utilized quads.
Across an entire mesh, or even an entire screen full of dense geometry, that can add up to serious performance issues.
So how can you check for quad overdraw in your project?
One way is to use the Partial Coverage Rate, which measures the proportion of quads that contain empty pixels.

A high value can indicate that the density or structure of the geometry in your scene is reducing efficiency because the GPU is doing more work to color the same number of pixels.
On its own, a high partial coverage rate suggests that the geometry in your game may be inefficient because of the shape or complexity of its meshes.
A high partial coverage rate combined with a high sample culling rate is a strong indicator of micro triangles. It also suggests the GPU is doing more work than necessary.
At that point, you may need to introduce level-of-detail (LOD) meshes. These reduce the number of triangles used for distant objects while maintaining their overall silhouette.
This is where Frame Advisor becomes useful. The mesh view lets you inspect the model used to draw an object, while stepping through draw calls shows its actual contribution on screen. This makes it easier to identify the worst offenders.
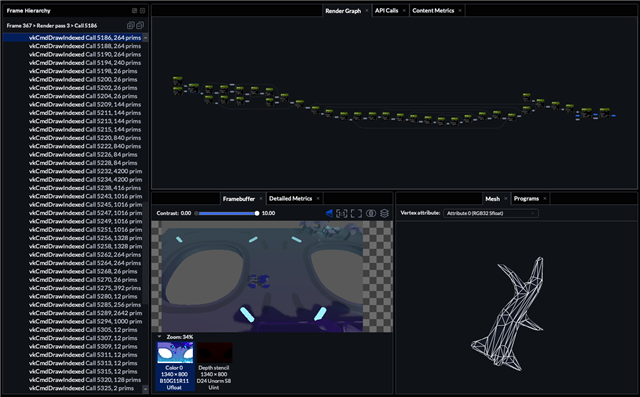
Frame Advisor also includes a dedicated overdraw capture mode, which can help you identify overdraw issues at a glance.
Overdraw is about efficiency. It is a ratio of work to visual output that can be used to test if the image you have could have been created in a more efficient way.
However, sometimes efficiency is not the problem.
While it is important to render the pixels in your scene as efficiently as possible, some performance issues simply come from trying to do too much.
One of the easiest ways to do that, particularly on lower-end devices, is through post-processing.
How to tell if there’s too much post processing in your game
Post-processing effects can be particularly expensive on mobile devices because they are both computationally expensive and memory-bandwidth intensive.
Streamline can help you measure the real impact of post-processing effects on a device. However, they can be difficult to identify in a capture because they are used in many different ways.
One telltale sign is an area of the frame with heavy fragment processing, high arithmetic utilization, and a high occluding quad rate. If you see that combination, there is a good chance that you are looking at 1 or more post-processing effects.

The occluding quad rate measures the percentage of quads that survive early depth testing. These quads are opaque and can occlude fragments behind them.
This is completely normal.
However, if you notice an area of the capture where the occluding quad rate is close to 100% with little or no other culling, that part of the frame is probably image processing rather than geometry.
This gives you an idea of how much of frame time is being spent on post-processing effects. If that is a significant amount, it may be worth reviewing them.
At that point, Unity’s Frame Debugger and the Render Graph can show which post-processing passes are active in your project. The Unity documentation can then help you identify the settings that are best suited for mobile.
Simply following Unity’s recommendations for mobile post-processing can lead to dramatic improvements in frame time.
But just how dramatic are we talking?
The real impact of performance profiling and optimization
We went to GDC with a fully functioning game demo built by an experienced game developer to show people how to profile and optimize their games.
But unlike some demo projects with “built-in problems” to find and fix, this one was not designed to perform badly.
It was built in a typical way by an experienced developer with reasonable levels of detail and visual polish.
Put simply, the goal was to build a game with real performance problems, not artificial ones.
The kinds of problems that are easy to introduce to just by building a game normally. The kind of performance issues that can appear even when your game seems to run perfectly well.
That made my job much harder because there was a real risk I would not find anything to improve.
So how much performance was there to find?
Quite a lot, as it turned out.
As is often the case, we found it was not hidden in one setting, or one dramatic change.
Instead, it was a series of small changes that each improved performance a little. Together, they added up to a game that runs significantly better while looking almost the same.
How we improved the performance of our game demo using profiling tools
The first thing I did was found an area of the demo that I could recreate every time I wanted to retest the game’s performance.
This was very important.
Big changes are usually obvious, but a small change might only save 1 or 2 ms, which can be impossible to detect unless everything else stays exactly the same.
In a production environment, you might use automated testing to track changes in performance over time. Streamline, in conjunction with Performance Advisor is particularly well suited to this because Performance Advisor can generate performance reports automatically.
For this example, the important thing was to keep everything else as consistent as possible so I could accurately measure the impact of each change.
So what did I change?
Streamline showed that late depth testing was happening in the middle of the frame. When I checked the URP settings, I noticed that Depth Texture Mode was set to After Opaques instead of After Transparents, which Unity recommends for mobile.
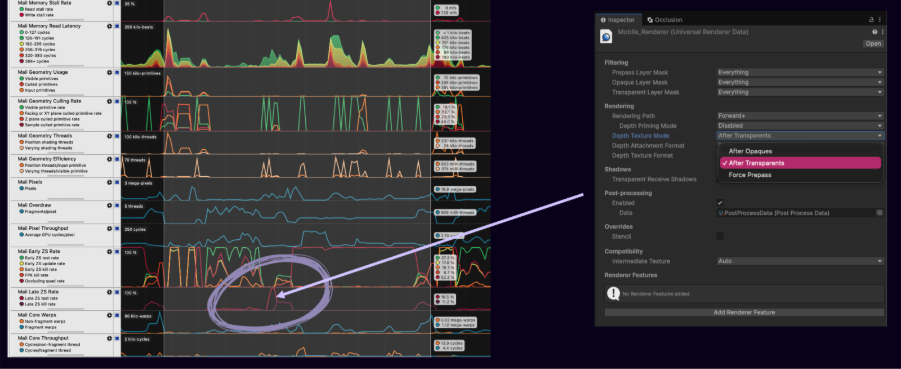
That change saved 3 ms.
Next, I still saw late depth testing in the Streamline capture. Comparing it with the Render Graph showed that it was caused by motion vectors. Changing the motion blur mode to Camera Only removed it.
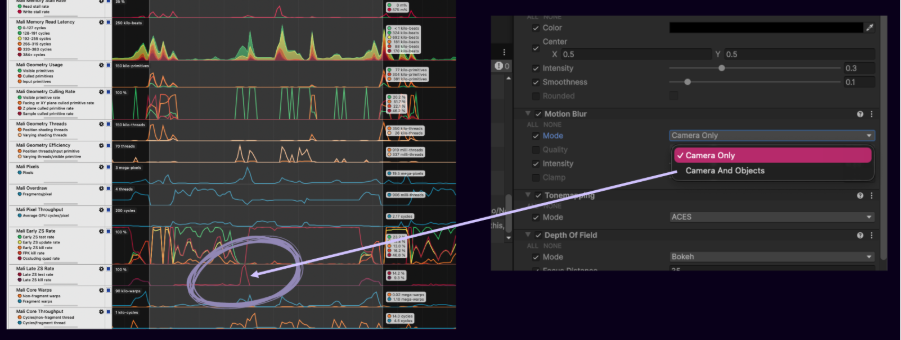
That saved another 1.5 ms.
Back in Streamline, I could still see late depth tests. This time, they were spread throughout fragment processing and combined by a higher overdraw value, suggesting cutout shaders.
In the scene, each floor section uses a single large cutout shader, but it does not need to.
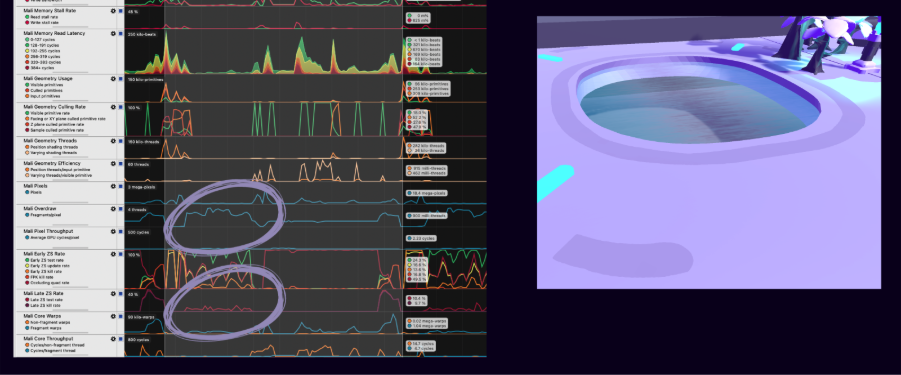
Switching to a material saved another 2.5 ms.
Next, it was time to investigate the large section with a 100% occluding quad rate, which suggested post processing.
Compared with Frame Advisor, I found that Unity’s Frame Debugger did not always show the visual output of each render pass. However, because it sits closer to the application, it labels each pass, making it easier to understand what is happening.
One of those passes was, surprisingly, an FSR upscaling pass.
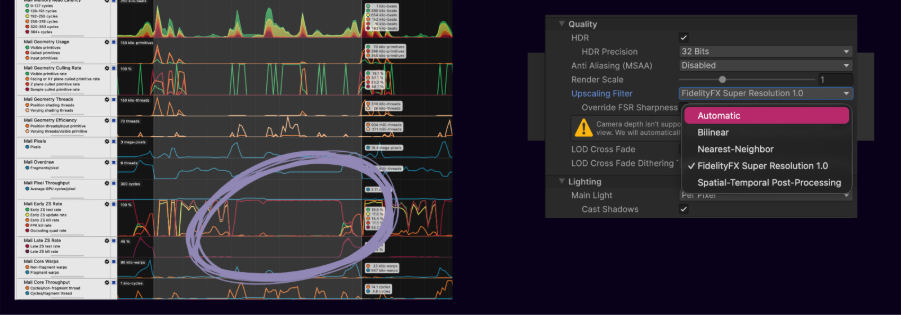
It was surprising because, although the demo supports upscaling, I was not using it. The render scale was set to 1, so this pass should not have been doing anything.
Normally, that is exactly what happens. Most upscaling filters do nothing when they are not needed.
FSR is the exception because it applies some sharpening and makes for a smoother transition from 1 to other render scales. This is a useful feature…
… as long as you are actually using it.
Upscaling can be expensive, but that cost is usually outweighed by the performance it saves. Until you reach that crossover point, however, the GPU is paying the processing cost without receiving any benefit.
In this case, turning it off changed almost nothing visually, but saved 6 ms of render time.
Next, I checked the other active post-processing effects to see whether they were configured efficiently. In this case, that meant bloom and depth of field.
For bloom, Unity recommends disabling high-quality filtering and reducing the downsampling rate to one quarter.
That saved another 2 ms.
The Unity documentation also recommended switching the depth of field effect from Bokeh to Gaussian blur.
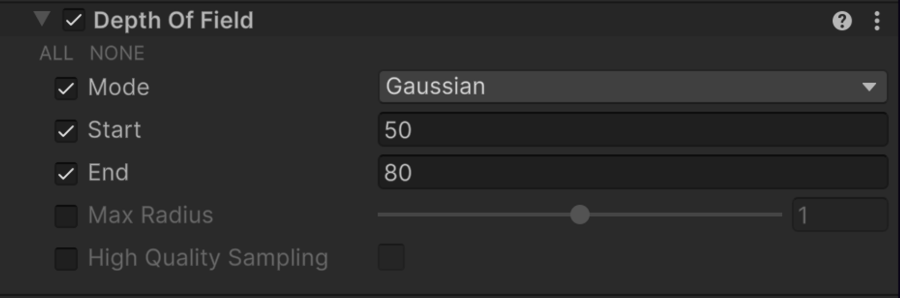
That saved another 4 ms.
The geometry in this project was already quite efficient. Even so, enabling lower-detail meshes at a distance saved another 2 ms.
Remember that geometry cost is not just about objects, it is also about shadows.
Removing the real-time lights in the scene, which were barely visible in most views, saved another 5 ms.
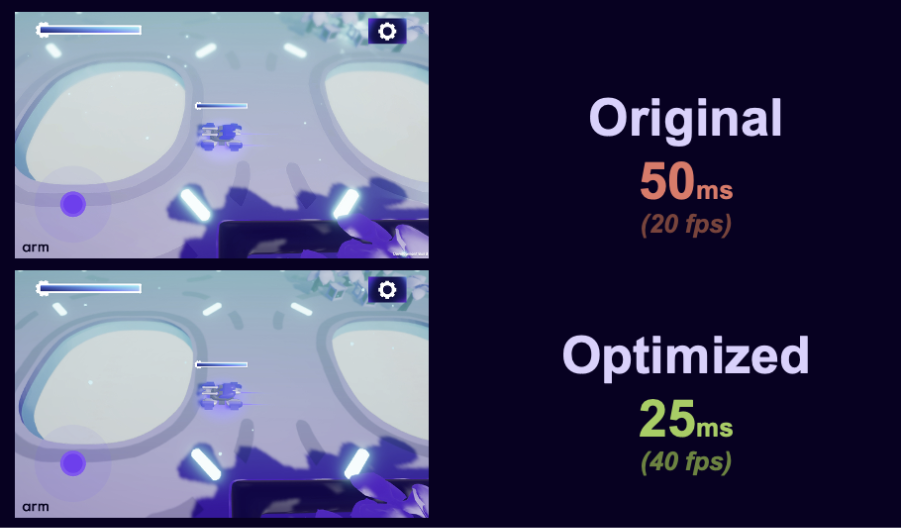
At the end of all that, we ended up with a game that looked almost identical to the original.
By using Streamline, Frame Advisor, and Unity’s built-in tools, we uncovered significant performance gains in a game that was already running well.
In this case, we reduced GPU frame time from 50 ms to 25ms.
That was the message we took to GDC.
That mobile optimization is usually not one big decision, it is lots of small ones.
That Arm Performance Studio can help you find hidden performance problems, even if you do not know where to start looking.
And that taking the time to profile and optimize your game on real hardware can uncover performance improvements you might not have thought were possible.
What to do next
If you are building a mobile game for Android, download Arm Performance Studio to see how Frame Advisor, Streamline, and our other profiling and analysis tools can help improve your game’s performance.
If you are new to mobile graphics optimization, subscribe to the Arm Game Developers YouTube channel for performance tutorials, deep-dives, and real-world case studies.

By John French
Re-use is only permitted for informational and non-commercial or personal use only.
