Frame Advisor 2026.3: Bringing clarity to API calls with debug labels
Learn how Frame Advisor uses Vulkan debug labels to organize API calls, name graphics objects, and make complex frame captures easier to understand
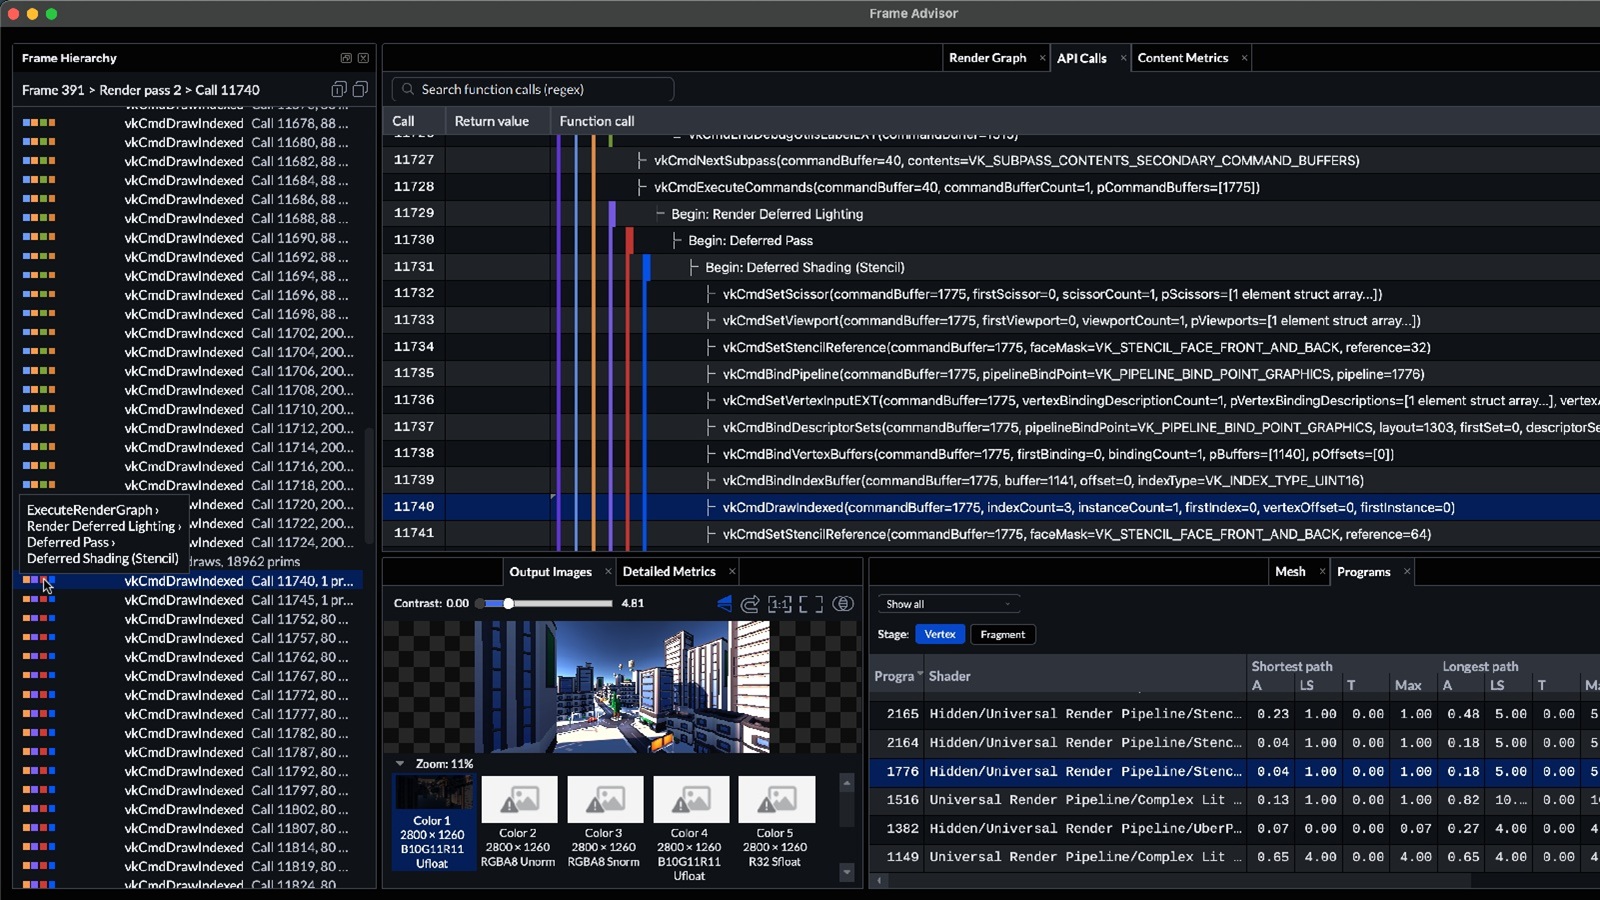
As graphics applications grow more complex, graphics and game developers often need to examine thousands, or even millions, of Vulkan API calls. They use this information to understand how rendering work maps back to their engine and application code. Arm Frame Advisor 2026.3 adds support for Vulkan debug labels in the API Calls and Frame Hierarchy views, making it easier to navigate complex frame captures. Frame Advisor displays developer-defined names for graphics objects and rendering regions directly in the analysis workflow. This helps developers quickly identify key rendering workloads, correlate captured commands with source code, and find relevant date more quickly.
The labels come in 2 types. Object labels let developers assign human friendly names to API objects, such as shaders or images. Region labels let developers insert begin and end markers to create groupings and hierarchies within the API calls stream. These labels help developers quickly identify the work associated with an API call.. In custom applications, they can also link API calls back to the original code.
The Vulkan API provides 2 extensions for adding these labels: VK_EXT_debug_marker and the newer VK_EXT_debug_utils. Both are supported in Frame Advisor but this article focuses on VK_EXT_debug_utils.
Unity and Unreal already generate these labels automatically so no additional setup is required.
Region labels
Debug regions are created using begin and end statements within your code. Regions can be nested, but a begin call must have a matching end call. In Vulkan use vkCmdBeginDebugUtilsLabelEXT to begin a region and vkCmdEndDebugUtilsLabelEXT to end it.
These functions allow you to specify a name and a color for the region. If no color is specified, for example if the alpha is zero, then default colors are used in a rotation.
In the API Calls view, debug regions are displayed as colored segments in the gutter to the left of the function call. Each colored segment continues until the matching end statement. Nested regions are shown by indenting the segment and its associated function calls.
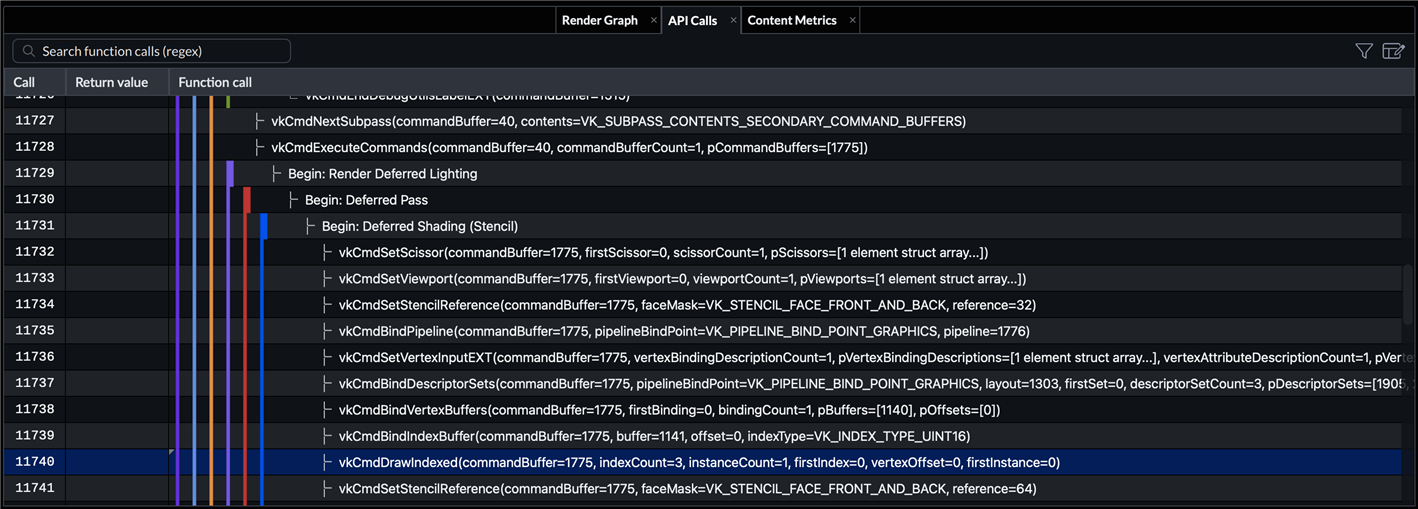
The Frame Hierarchy view also displays debug regions as barcodes. Hover over a barcode to view the label hierarchy in a tooltip. The barcode colors match the colors used in the API Calls view.
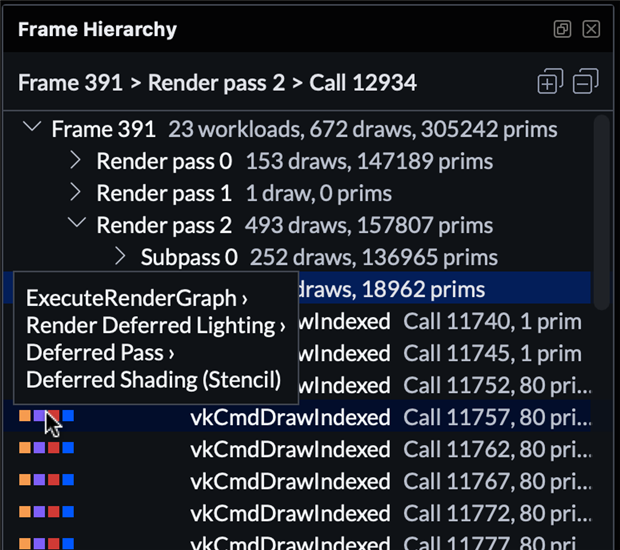
Keep region names short and descriptive and avoid excessive nesting levels to prevent interface clutter.
Object labels
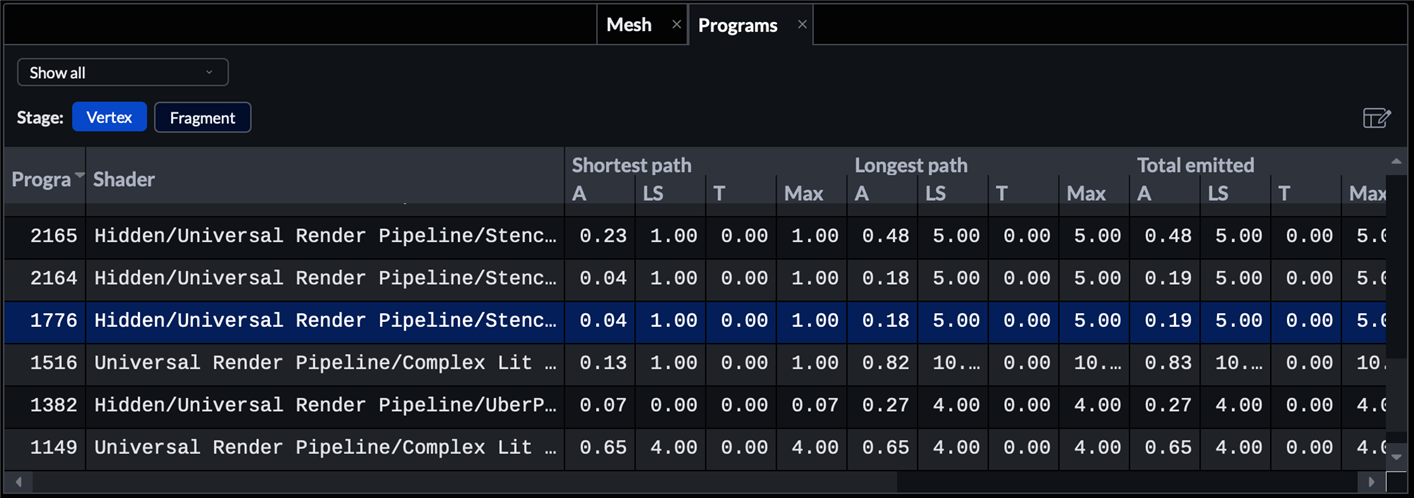
Developers can assign custom labels to graphics objects, making them easier to identify in tools. In Vulkan, use vkSetDebugUtilsObjectNameEXT to assign these labels. Frame Advisor currently exposes these names in two places. The first is the Programs view, if any shader module has been given a name it will be used in place of the API ID which is normally displayed.
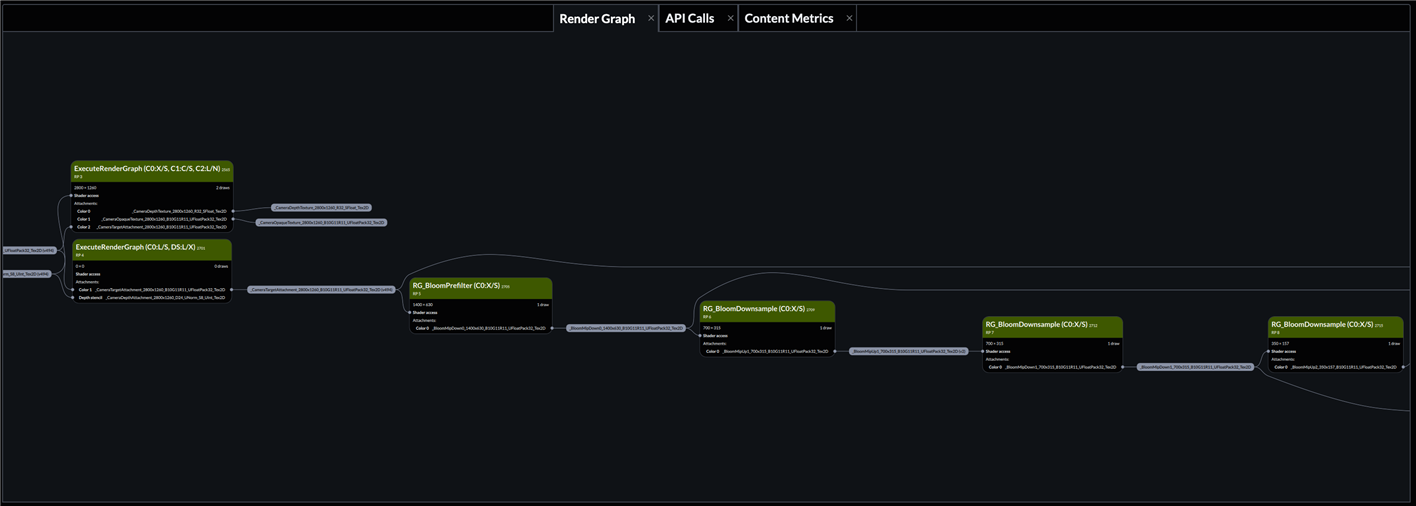
The second location is the Render Graph. If a Render Pass object has a custom name, Frame Advisor displays it instead of the automatically assigned name.
Conclusion
Debug labels help developers organize the large number of API calls generated by an application. When used effectively, they make objects and API calls easier to identify and help developers focus on graphics workloads that require attention.
Download Arm Performance Studio and explore the new features in Frame Advisor 2026.3 today.
Download Arm Performance Studio

Re-use is only permitted for informational and non-commercial or personal use only.
