40% faster image classification on AWS Graviton: how Vociply used Arm Perfomix to cut costs 29%
Optimize TensorFlow Lite on AWS Graviton with Arm Performix. Identify bottlenecks, boost throughput by 40%, and reduce ML inference costs.
We optimized a TensorFlow Lite image classification workload on AWS Graviton instances using Arm Performix, achieving 40% throughput improvement (2.21 to 3.11 images/second) by identifying and eliminating a preprocessing bottleneck. The Arm Performix Code Hotspots recipe reveals that 65% of CPU time runs on inefficient Python loops during image normalization, not on model inference as first assumed. By vectorizing these operations with NumPy, this reduces preprocessing overhead from 65% to 28% of total execution time. It enables faster response times and lowers compute cost by 29% for production ML workloads.
Problem or goal
Cloud-based ML inference services face three critical challenges when they scale image classification workloads:
- Cost scaling: Processing millions of images daily on x86 instances becomes expensive. AWS Graviton offers 40% better price-performance, but migration requires optimization and validation.
- Performance uncertainty: Migrating TensorFlow models to Arm does not guarantee optimal performance. Unoptimized code can remove architecture benefits.
- Blind optimization: Without architecture-specific profiling tools, developers optimize the wrong code paths based on assumptions rather than data.
Our application processes user-uploaded images for content classification in a SaaS platform. The initial Graviton deployment shows cost savings but underwhelming throughput. It processes 2.21 images per second on a t4g instance, which is far below the 4-5 images per second from TensorFlow Lite benchmarks.
The question: Was the bottleneck in our preprocessing pipeline, the model inference, or somewhere else entirely?
Without Arm-specific profiling, we risk spending weeks optimizing the wrong components. We need visibility into where CPU cycles run on Graviton hardware.
Our goal is to identify the performance bottleneck using Arm-native profiling tools, implement targeted optimizations, and achieve throughput competitive with published TensorFlow Lite benchmarks, while we maintain classification accuracy.
Solution overview
We use Arm Performix to profile our TensorFlow Lite inference pipeline running on AWS Graviton:
- Configured APX to connect to our EC2 t4g instance via SSH
- Used Arm Performix Code Hotspots recipe to profile the complete inference workflow
- Analyzed Arm Performix function-level CPU time breakdown to identify bottlenecks
- Refactored preprocessing code based on APX findings (vectorized NumPy operations)
- Re-profiled with APX to validate optimization impact
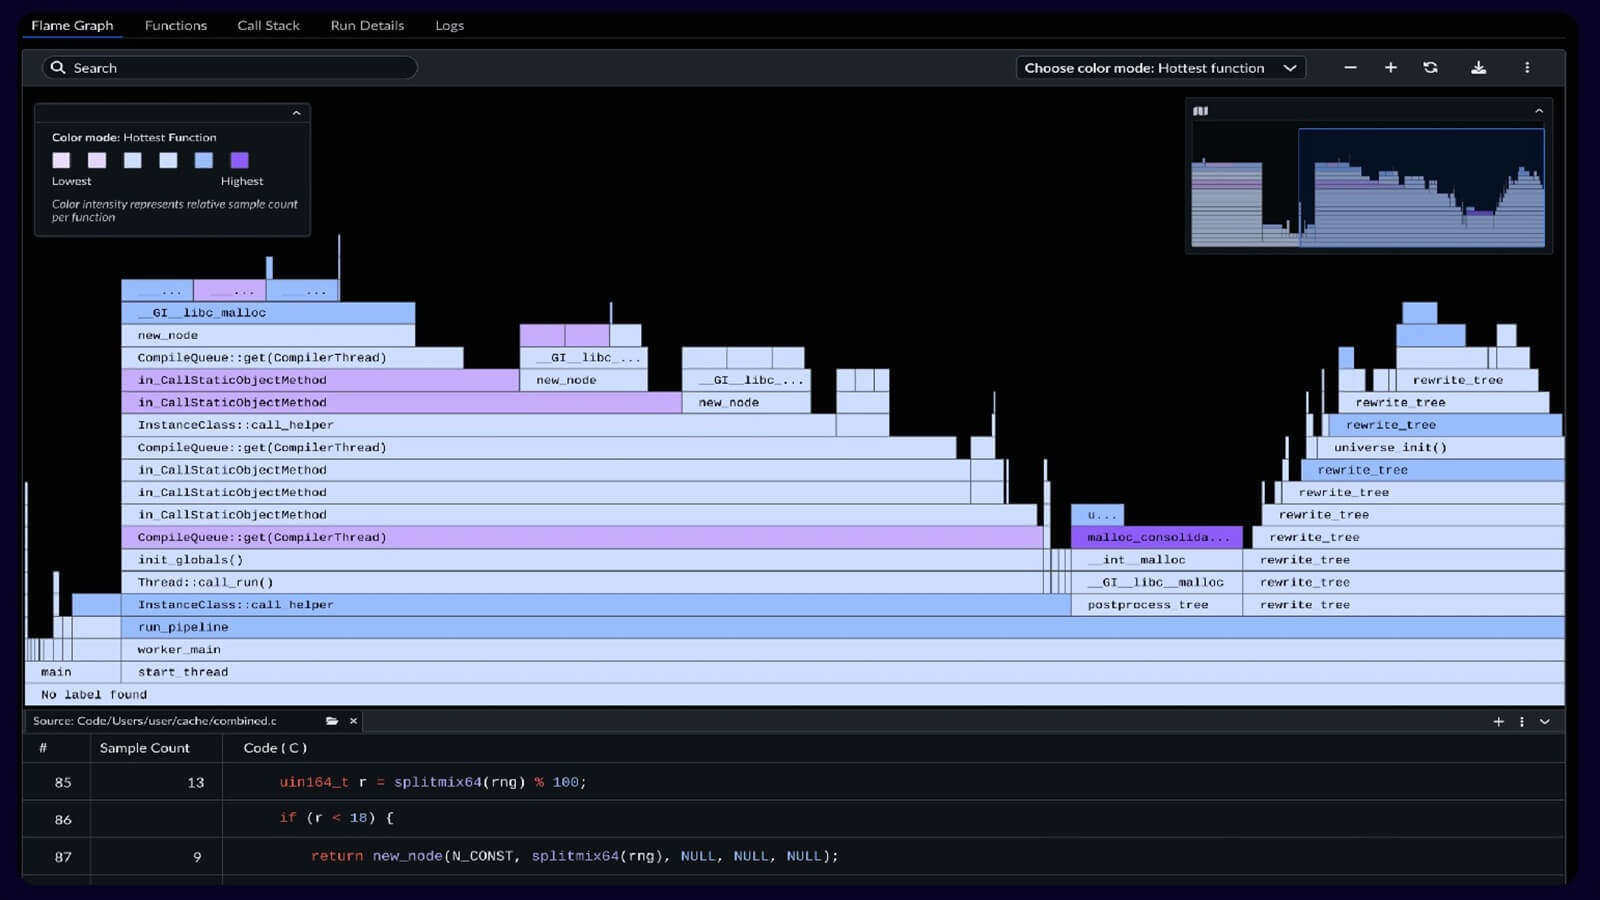
APX takes 3 minutes to set up and reveals the bottleneck in a single profiling run. Preprocessing consumes 65% of CPU time due to nested Python loops, while the TensorFlow Lite inference, which we assumed was the problem, used only 22%.
The fix is a simple code change, replacing pixel-by-pixel normalization loops with vectorized NumPy operations that delivers 40% throughput improvement.
Technical details
Hardware:
- Platform: AWS EC2 Graviton (t4g.small)
- CPU: Arm Neoverse N1, 2 vCPUs
- Architecture: Armv8.2-A
- Memory: 2GB RAM
- OS: Ubuntu 24.04 LTS Arm64
Software stack:
- Profiling Tool: Arm Performix (APX) - Code Hotspots recipe
- ML Framework: TensorFlow Lite 2.15 for Arm64
- Model: MobileNet v1 Quantized (INT8, 224×224 input, 1.4GB)
- Language: Python 3.12
- Libraries: NumPy 1.26, Pillow 10.1, tflite-runtime 2.15
Key configurations:
- APX profiling duration: 60 seconds (covering 100 image inferences)
- TFLite threads: 2 (matching vCPU count)
- Image preprocessing: Resize to 224×224, normalize to [-1, 1] range
- Benchmark workload: 100 images downloaded from test dataset
Optimizations applied:
- Baseline: Nested Python loops for pixel normalization (3 nested for-loops)
- Optimized: Vectorized NumPy array operations ((img_array - 127.5) / 127.5)
- Memory allocation: Pre-allocated NumPy arrays to reduce allocation overhead
- Image format: Converted to RGB once before processing (avoided repeated conversions)
Architecture diagram
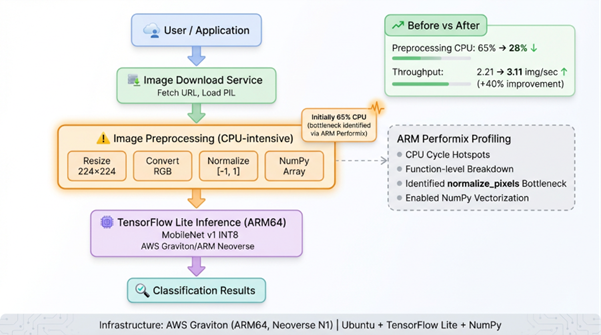
1. Image download
- Fetch image from URL
- Load into PIL image object
2. Preprocessing (65% CPU baseline)
- Resize to 224 x 224
- Convert to RGB
- Normalize pixel values to [-1, 1]
- Convert to NumPy array
- Bottleneck identified in this stage
3. TensorFlow Lite inference (22% CPU baseline)
- Load quantized MobileNet model
- Run inference on preprocessed data
- Return classification scores
4. Output
- Return classification result
Arm Performix profiling:
- Connect to EC2 instance over SSH
- Use Code Hotspots recipe
- Run profiling for 60 seconds or more
- Analyze function-level breakdown
Challenges and solutions
Challenge 1: identifying the actual bottleneck without guessing
We first assume that TensorFlow Lite inference is the performance limiter, but we do not have data to confirm this on Arm architecture.
Solution: The Arm Performix Code Hotspots recipe provides a function-level CPU time breakdown. One profiling run shows that preprocessing uses 65% of CPU time, which is the real bottleneck. Interference uses 22% of CPU time.
Result: We avoid weeks of effort spent optimizing TensorFlow Lite settings. APX directs us to the actual problem in 3 minutes.
Challenge 2: understanding why preprocessing was slow
Arm Performix shows that preprocessing consumes 65% of CPU time. This view is aggregated at a high level and does not identify the specific operation responsible.
Solution: We examine the function-level breakdown within the preprocessing stack. It isolates normalize_pixels as the dominant hotspot, accounting for 52% of total CPU time. This shows that the nested loop implementation is inefficient.
Result: We replace the nested Python loops with a vectorized NumPy operation, which reduces preprocessing from 65% to 28% of CPU time.
Challenge 3: validating that optimization actually worked
After the code changes, we need to confirm that the improvement is real and not a measurement artifact.
Solution: We re-profile with APX using an identical workload (same 100 images, same duration). APX shows that preprocessing drops from 65% to 28% CPU time, while inference increases from 22% to 58% . Interference is now the dominant operation, as expected.
Result: APX provides clear before and after validation. Throughput improves by 40% and CPU time distribution changes as expected.
Results
Performance metrics
|
Metric |
Baseline |
Optimized |
Improvement |
|
Throughput |
2.21 img/sec |
3.11 img/sec |
+40.7% |
|
Latency (avg) |
452ms |
321ms |
-29.0% |
|
CPU: Preprocessing |
65% |
28% |
-57% |
|
CPU: Inference |
22% |
58% |
+164% |
|
Total processing time (100 images) |
45.2s |
32.1s |
-29.0% |
APX code hotspot analysis
Baseline (before optimization):
Function CPU Time % Total
──────────────────────────────────────────────────────
preprocess_image_slow 65.3% ████████████████
└─ normalize_pixels (loops) 52.1% ████████████
run_inference (TFLite) 22.4% █████
download_image 8.7% ██
other 3.6% █
Optimized (after vectorization):
Function CPU Time % Total
──────────────────────────────────────────────────────
run_inference (TFLite) 58.2% ██████████████
preprocess_image_optimized 28.3% ███████
download_image 10.1% ██
other 3.4% █
Why Arm Performix Arm-specific profiling makes the difference
- Architecture awareness: APX is tuned for Arm Neoverse cores, providing accurate CPU cycle accounting that generic profilers miss
- Function-level granularity: Pinpointed the exact function (normalize_pixels) consuming CPU time, not just broad categories
- Minimal overhead: Arm Performix profiling added <2% overhead, ensuring measurements reflected real performance
- SSH-based deployment: No code instrumentation required. Profiled production-like workloads without modification
Real-world impact
Cost savings at scale:
Processing 1 million images per day:
- Before: 126 instance hours per day at $0.0168 per hour equals $2.12 per day. This equals $63.50 per month.
- After: 90 instance hours per day at $0.0168 per hour equals $1.51 per day. This equals $45.36 per month.
- Savings: $18.14 per month for 1 million images per day. This equals $217.68 per year.
A SaaS platform that processes 10 million images per day across multiple regions saves about $2,176 per year in compute cost. This results from a small code change.
Operational benefits:
- Faster API response times improve user experience. Response time decreases from 452 ms to 321 ms.
- Higher throughput per instance reduces infrastructure complexity.
- Lower CPU utilization improves burst capacity. This results from improved preprocessing efficiency.
Key takeaways and tips for other developers
Why Arm Performix for Graviton optimization
- Don't assume, profile: We first assume that inference is the bottleneck, which is incorrect. APX identifies the bottleneck in one run.
- Arm-specific tools matter: Generic Python profilers do not provide Arm architecture insights that APX delivers.
- Fast iteration: Arm Performix takes 3 minutes to set up. Profiling cycles takes less than 5 minutes. This enables rapid optimization testing.
- Production-ready: APX works via SSH on live instances, no code changes, no redeployment
Quick start recommendations
- Start with Code Hotspots recipe: It identifies function-level bottlenecks in application code.
- Profile realistic workloads: Use production data volumes for accurate results. For example, use 100 images.
- Run for more than 60 seconds: Longer profiling windows reduce noise and capture representative behavior.
- Compare results before and after changes: APX makes validation easy so use same recipe and the same workload. This shows a clear difference.
Success factors
- APX revealed the non-obvious: Preprocessing bottleneck wasn't apparent without profiling
- Vectorization was the key: Python loops are slow; NumPy operations leverage Arm SIMD instructions
- Validation was easy: Arm Performix consistent profiling methodology made before/after comparison reliable
- Cost impact was measurable: 40% throughput gain translated directly to 29% lower compute costs
Common pitfalls to avoid
- Don't optimize blindly: We almost wasted time on TensorFlow Lite settings before APX redirected us
- Measure on Arm hardware: x86 profiling results don't transfer—use APX on actual Graviton instances
- Focus on percentage, not absolute time: A function taking 5ms but running 10,000 times matters more than a 100ms function called once
Links to code, repos, or further reading
GitHub repository:
- Arm-FT-Lite: GitHub - MarwaMasese/ARM-FT-Lite
Official Arm resources:
- Arm Performix for Neoverse: Arm Performix: Analyze and optimize workloads on Arm Neoverse
- Arm Performix install guide: Arm Performix Install Guide
Community support:
- Arm Developer Community: Arm Community
Impact statement
This implementation demonstrates that migrating ML workloads to Arm is not limited to changing instance types. It requires Arm-specific profiling to unlock the full potential of the architecture. Arm Performix provides the visibility to identify and fix a bottleneck that generic profiling tools do not detect.
For ML practitioners moving to Graviton, APX is not optional. It distinguishes between a working system and an optimized system. The 40% performance gain comes from fixing code that performs well on x86 but performs poorly on Arm due to different SIMD characteristics.
We show that 3 minutes of APX profiling can guide optimizations that deliver measurable cost savings at scale. The bottleneck is not where we expected, and without Arm Performix Arm-native insights, we would have optimized the wrong code.
Cornelius Maroa is an AI Engineer at Vociply and an Arm Ambassador focused on building and optimizing production-grade AI systems for real-world applications. His work centers on improving the performance and efficiency of AI workloads on Arm-based infrastructure, with a strong emphasis on inference optimization, scalability, and cost-effective deployment. He has experience across AI infrastructure, agentic systems, and voice AI platforms, working end-to-end from model development to production deployment.

Re-use is only permitted for informational and non-commercial or personal use only.
