Arm Performix: Practical performance analysis for Arm-based servers
Optimize Arm workloads with Performix. Detect bottlenecks, apply SIMD, and validate improvements through structured and repeatable analysis workflows.
By Julie Gaskin

As Arm-based infrastructure continues to scale across cloud and data center environments, developers are increasingly responsible for understanding and optimizing performance on Arm Neoverse CPUs. Additionally, agentic AI workflows introduce new performance challenges, where efficiency must be considered across entire systems rather than individual components.
Recent announcements such as the Arm AGI CPU highlight this shift, with platforms designed for highly parallel, agent-driven workloads. In this context, performance analysis extends beyond code tuning. it is about understanding how efficiently work is executed across the system. Arm Performix supports this shift by helping you optimize and scale workloads on today's platforms and prepares you for next-generation compute.
Following the Arm Performix announcement, this blog focuses on how you can use the toolkit in practice, with a simple example and walkthrough.
What is Arm Performix?
The hardware provides powerful capabilities, however, converting low-level performance data into actionable insights requires specialist knowledge and fragmented tooling. Performix is designed to change that. Now generally available, it is a performance toolkit that helps you identify bottlenecks and validate improvements, using workflows that are systematic, repeatable, and accessible.
Performix collects performance data directly from Arm-based hardware during execution. It presents results as metrics and visualizations, with guided insights. Performance cost is attributed to functions, call paths, and execution phases. This helps you understand why a workload is slow, not just where time is spent.
Rather than exposing raw counters, Performix structures analysis around recipes, providing guided analysis paths that help you answer common performance questions and move quickly from observation to root cause:
- Where is my application spending CPU time?
- Is performance limited by compute, memory, or speculation?
- How are Arm architectural features like SIMD, SVE and SVE2 being used?
- Which functions should I optimize first?
- Did my code update improve efficiency?
This approach allows you to focus on optimization decisions instead of tool mechanics.
Recipes and runs
At the heart of Performix are two key concepts: recipes and runs.
Recipes
A recipe defines how how to collect, analyze, and visualize performance data for a specific goal.Each recipe selects profiling features, configures data collection. It presents results using views such as flame graphs, function tables, and call stacks.
At launch, Arm Performix includes five standard recipes:
- Code Hotspots, which identifies where execution time is spent and also allows you to directly compare between runs.
- CPU Microarchitecture, which gives you a broad, structured view of any bottlenecks and hotspots. You can then focus on the areas where optimization will have the most impact.
- Instruction Mix, which understands how code uses different instruction types and Arm architectural features.
- Memory Access, which analyzes how your software interacts with the memory system and identifies where latency occurs. The recipe uses the Arm Statistical Profiling Extension (SPE) to sample load and store operations at low overhead.
- System Characterization (in preview), which runs the Arm System Characterization Tool (ASCT) to collect system information and microbenchmark results. It measures memory latency/bandwidth behavior to help with platform bring-up, tuning, and architectural comparisons.
These recipes provide a structured path from high-level system behavior to detailed root-cause analysis. Additional recipes are in development to extend Performix with new analysis workflows in future releases.
Runs
A run contains the analysis results returned after a recipe is executed. You can save, compare, export, and reload runs. This enables you to iterate on performance changes and integrate Performix into automated workflows.
Why Arm Performix is different
If you’re familiar with tools such as perf, you will recognize the value of hardware performance counters, but also the cost of interpreting them.
Performix differs in three important ways:
- Guided analysis: Performix applies Arm’s standardized performance methodologies and presents results with context and suggested next steps.
- Function attribution: Performance metrics are attributed directly to functions and call paths, making results immediately actionable.
- Low-overhead sampling: Performix is designed to preserve realistic workload behavior, allowing analysis on representative runs.
- Fast to get started: Go from setup to useful results in minutes, without stitching together multiple tools or workflows.
The result is a faster path to understanding performance, especially if you are not a performance expert.
Fast, guided setup
Arm Performix supports a fast setup and analysis workflow. It's easy to install and the intuitive GUI guides you through the setup process, from connecting to a target system to running your first analysis.
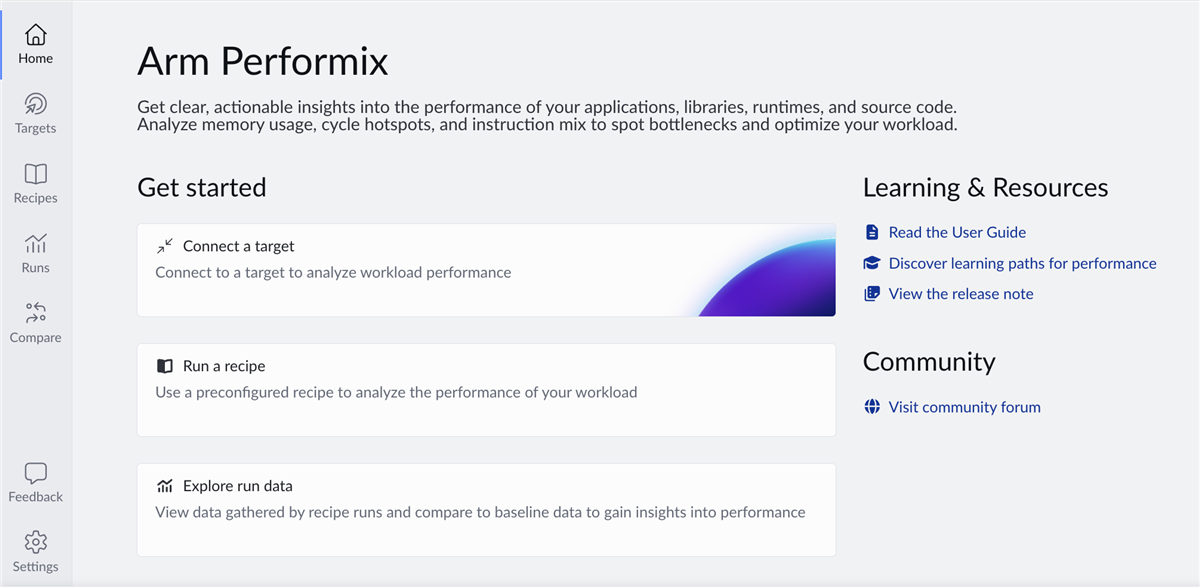
You can go from installation to your first useful results within minutes. Connect to your target, select a recipe and run your workload. Performix collects and analyses data automatically, presenting results as visualizations and guided explanations which removes the need to manually configure multiple tools or combine workflows, allowing you to focus on understanding performance rather than setting up profiling.
Integrating Arm Performix into developer workflows
Performix integrates with modern development environments. You can run Performix from the command-line and export results in machine-readable formats. You can compare results across runs, making it easier to detect regressions and track performance changes over time. This makes Performix suitable for interactive analysis and for CI/CD pipelines where performance regressions need to be detected early.
You can integrate Performix into AI-assisted workflows using the Arm MCP Server, which implements the Model Context Protocol (MCP) to expose system and performance tooling through a structured interface. AI assistants such as GitHub Copilot or Codex can then invoke Performix analysis workflows, query profiling data, and retrieve insights programmatically. For example, you can request hotspot analysis, inspect Topdown metrics, or review instruction mix results directly from your editor. By exposing performance data through MCP, Performix connects code, tools, and analysis. This enables more iterative and automated optimization without manual navigation of profiling tools.
Example: Finding hidden inefficiency in a simple loop
To demonstrate how Performix helps uncover real performance issues, we will use a deliberately simple workload: a vector dot product. The benchmark computes the dot product of two large floating-point arrays:
sum += a[i] * b[i];
It performs one multiply and one add per loop iteration. The pattern is simple, predictable, and seemingly efficient. It appears in real-world applications everywhere:
- Machine learning inference
- Signal processing
- Linear algebra
- Analytics pipelines
You will find the source file for this benchmark in the zip file attached to this blog.
Build this workload on the target machine with vectorization disabled to ensure it remains purely scalar and is not auto-vectorized by the compiler:
g++ -O3 -g -fno-omit-frame-pointer -fno-tree-vectorize -mcpu=native -std=c++17 dot_scalar_problem.cpp -o dot_scalar
Key flags:
-O3– realistic optimization level-g– debug symbols for source-level attribution-fno-omit-frame-pointer– preserves call stacks for profiling-fno-tree-vectorize– prevents compiler auto-vectorization-mcpu=native– tune for the target CPU.
Capture performance data with Arm Performix
With Performix, you can run the Code Hotspots recipe, which quickly shows where CPU time is spent and provides a starting point for investigation.
When specifying the workload path, you can include parameters to control execution. Arm recommends collecting at least 20 seconds of profiling data to ensure statistically meaningful sampling. Run the example with 16M floats and an iteration count of 2000, which should result in around 30 seconds of runtime.
./dot_scalar 16777216 2000
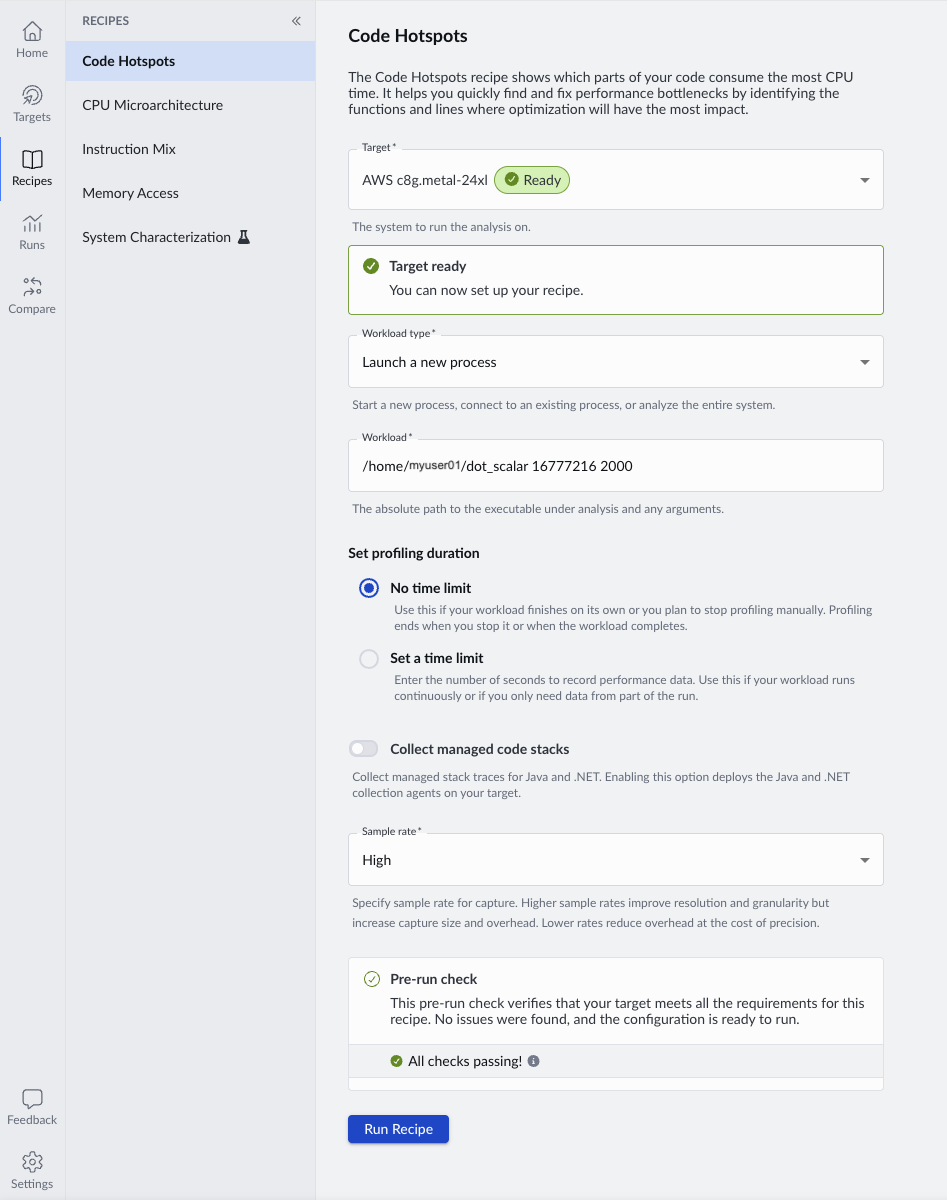
When you run the recipe, Performix launches the workload on the target and collects periodic samples during execution.
The first clue… a dominant hotspot
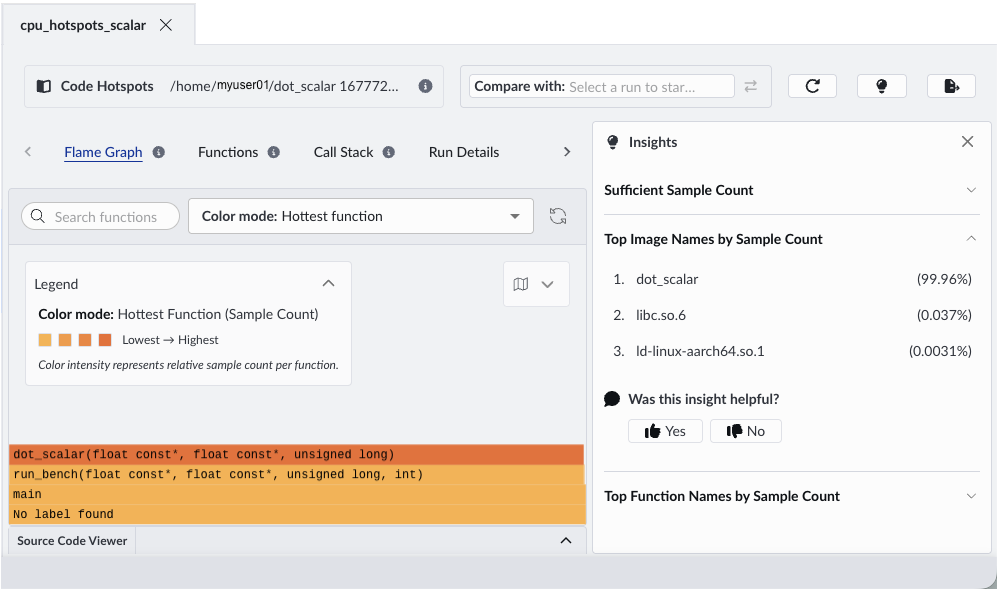
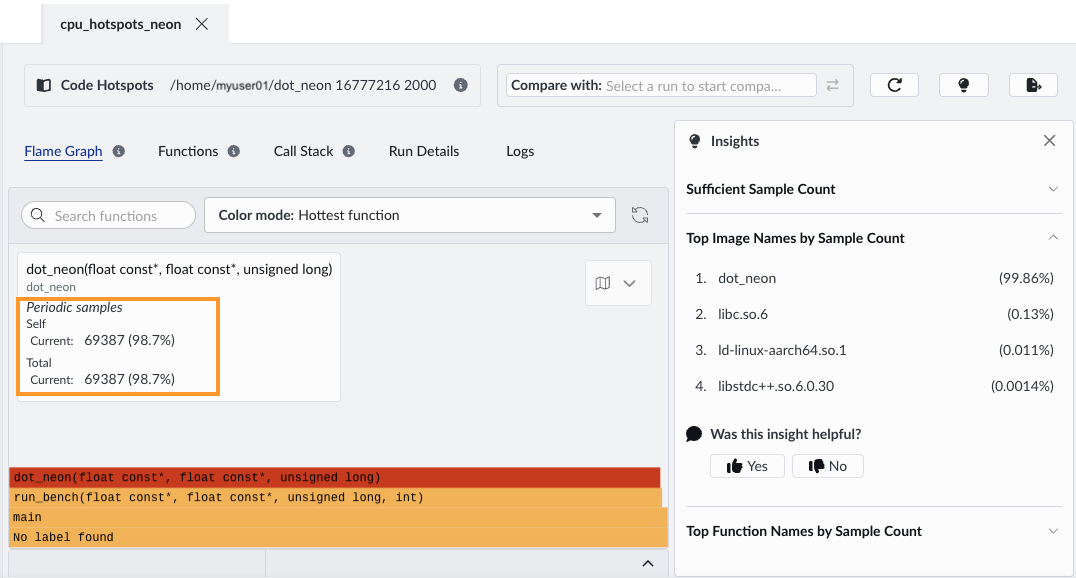
When the run completes, Performix automatically opens the results. The flame graph highlights where the CPU spends most of its time.
Flame graphs show where your program spends time during profiling. Each box represents a function, and its width shows how frequently it appears in those samples. The stacked layout shows call paths, which helps you see how each function is reached. In practice, you can quickly identify optimization opportunities by focusing on the widest blocks, which represent the most significant contributors to runtime.
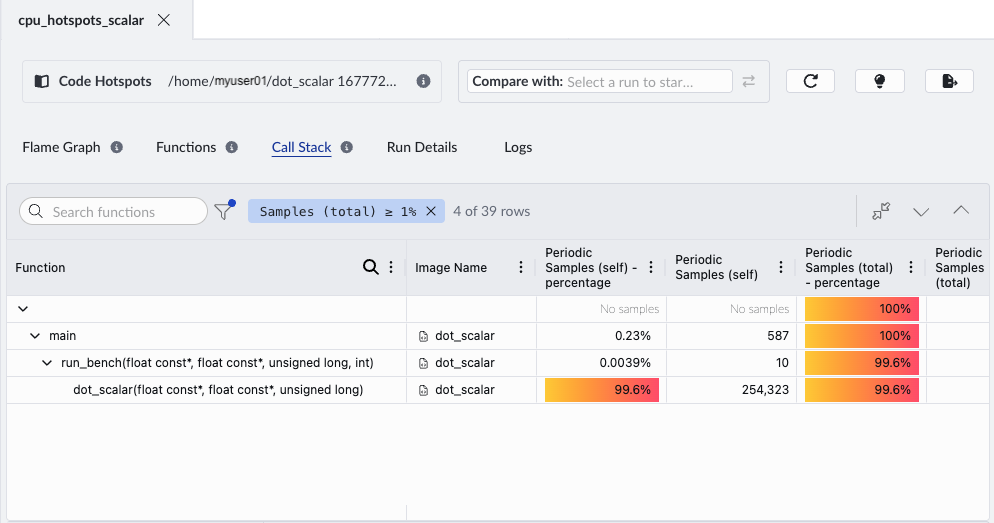
In this example, a single compute-heavy function dot_scalar dominates the width of the flame graph, indicating that it accounts for a large proportion of total CPU cycles. The insights panel shows that this function accounts for 99.96% of samples.
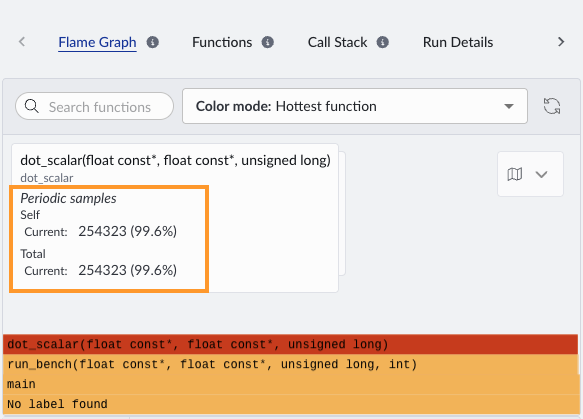
If we hover over this function in the flame graph, we can see the sample count for the dot_scalar function is 254,323:
Use the Call Stack view to see how the hotspot function is reached and whether its cost comes from the function itself or from its callees.
Double-click the hotspot function to open the source code viewer, so you can inspect the exact lines of code associated with high CPU usage. When you open the source code viewer for the first time, specify the root directory of your source code. This enables Performix to map profiling data to the correct files.
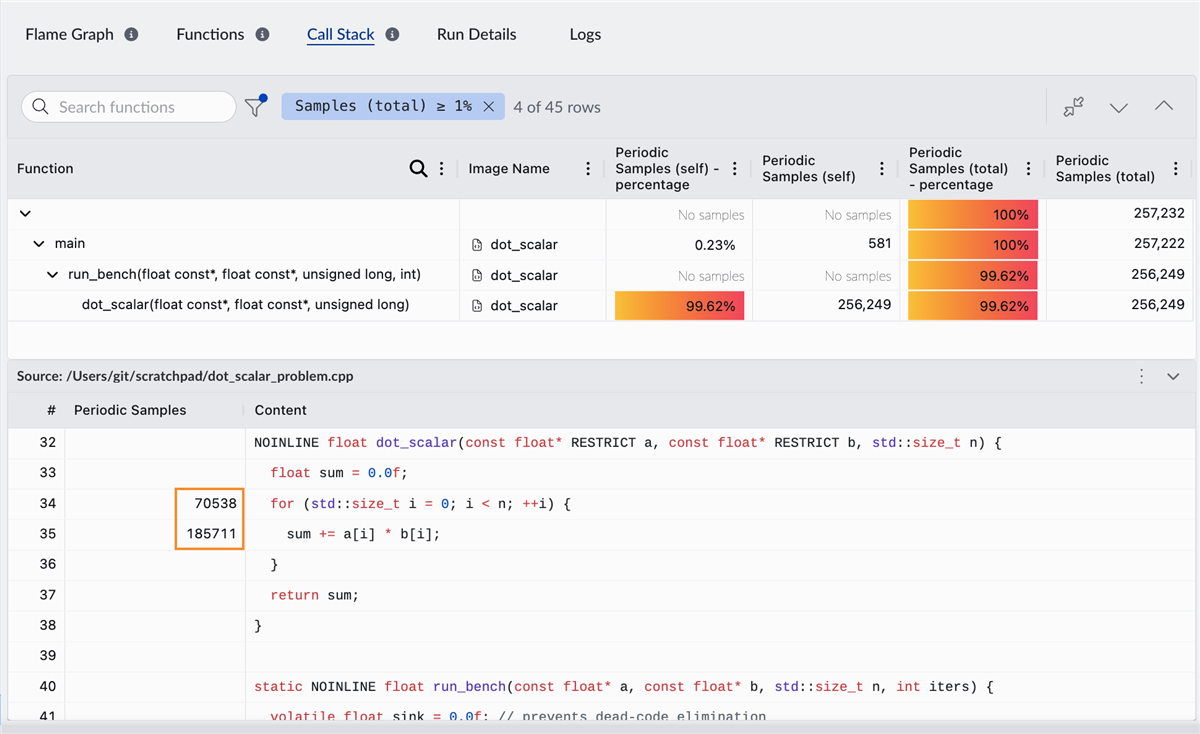
This function performs most of the workload computation, so you expect it to be a hotspot. Next, we examine how the CPU processes this workload
Is the CPU working efficiently?
Now run the CPU Microarchitecture recipe. This uses Topdown analysis to show how CPU execution capacity is used, separating useful work from cycles lost to stalls or inefficiencies. This is a standardized methodology that breaks down CPU execution into a hierarchy of bottlenecks, helping you systematically identify where performance is lost.
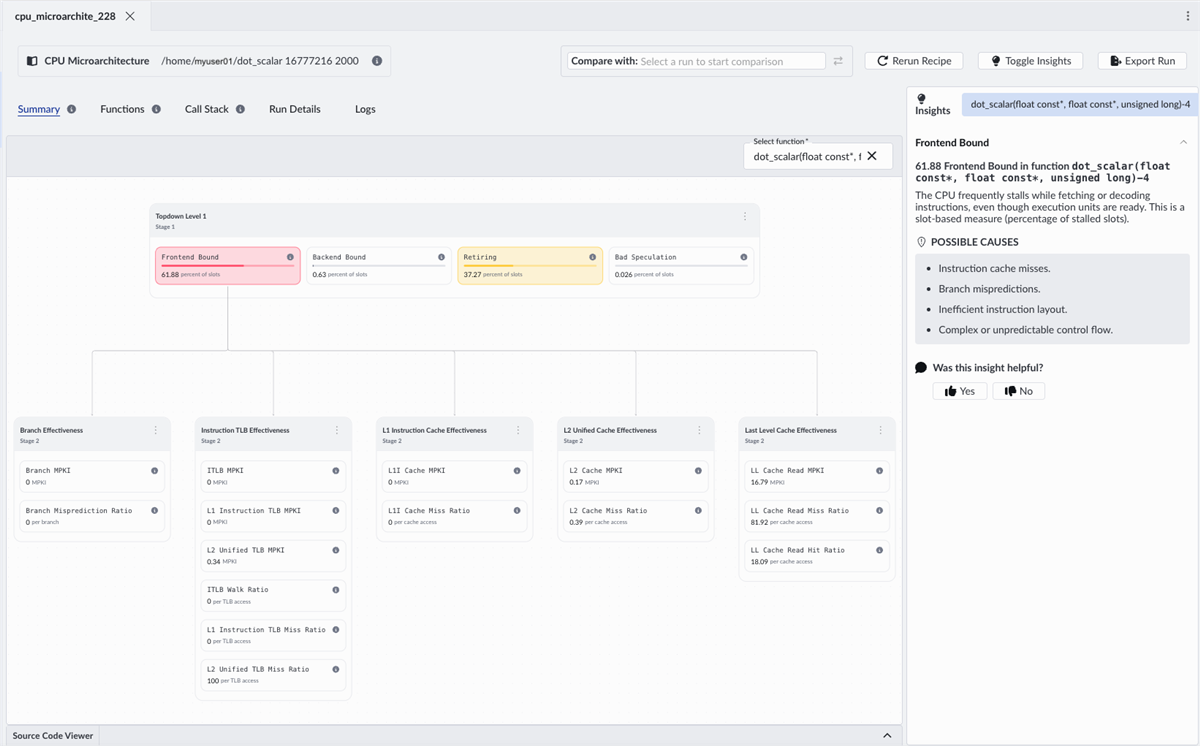
Performix shows that the workload is over 60% frontend bound. The CPU frequently stalls while fetching or decoding instructions, even though execution units are ready. In Topdown terms, this means execution slots are being lost in the frontend, even though backend resources are available.
In other words, the CPU isn’t compute-bound, it’s waiting for instructions.
Why is the frontend the bottleneck?
Now that we know where the bottleneck is, we need to understand why. Performix provides immediate guidance:
- Instruction cache inefficiency
- Branch-related effects
- Inefficient instruction layout
- Complex control flow
But this is where context matters. This is a simple, tight loop. So what is really going on?
We dig deeper using the Instruction Mix recipe.
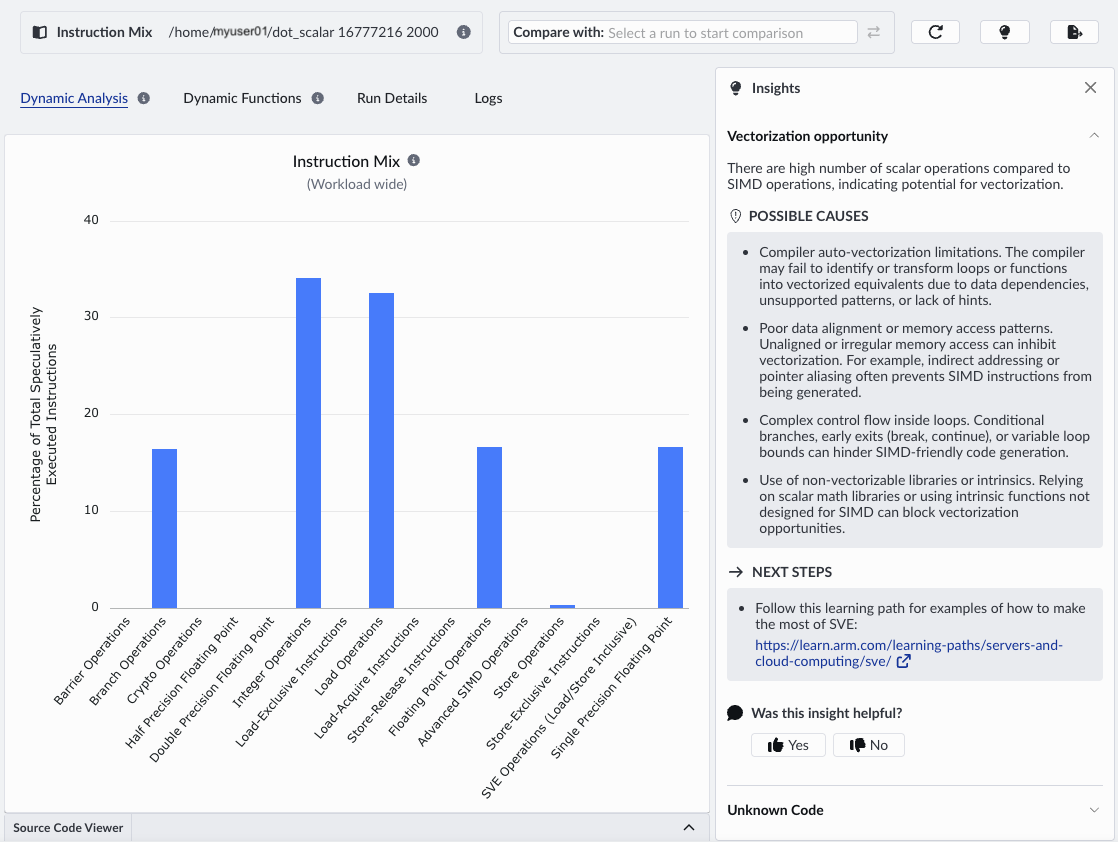
Instruction Mix shows that the workload is dominated by scalar operations, with no SIMD usage. The frontend is overloaded because the code uses too many instructions to do only a small amount of work.
Even though only a small amount of work is done, each iteration consumes instruction bandwidth. This creates sustained frontend pressure on the frontend, not because instruction fetch is slow, but because too many instructions are required.
The insights panel lists the possible causes. It correctly identifies that we are not making use of SIMD and are missing vectorization opportunities. Vectorization reduces the number of instructions required per element by performing multiple operations per instruction, directly relieving frontend pressure.
Turning insight into performance
Let’s replace the scalar loop with a NEON implementation. Refer to the source code in the attached zip file to see the optimized file.
- Each instruction processes 4 elements
- Fused multiply-add increases efficiency
- SIMD pipelines are actively used.
Importantly:
- Memory access pattern remains identical
- Branch structure remains identical
- Working set size remains identical
The only change is the introduction of data-level parallelism using Advanced SIMD to process multiple elements per instruction.
When we run the same recipes with the optimized version, the most obvious improvement is wall-clock time and total cycle count. This comes from processing four elements per loop iteration with SIMD. The flame graph shows the same dominant function, but the sample count decreases, from 254,323 to 69,387.
Re-running the Instruction Mix recipe, we see:
- Increased percentage of Advanced SIMD instructions
- Reduced proportion of scalar floating-point operations
- Fewer loop-control instructions relative to work done
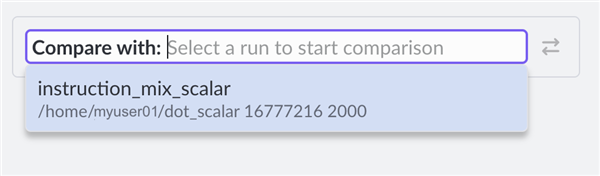
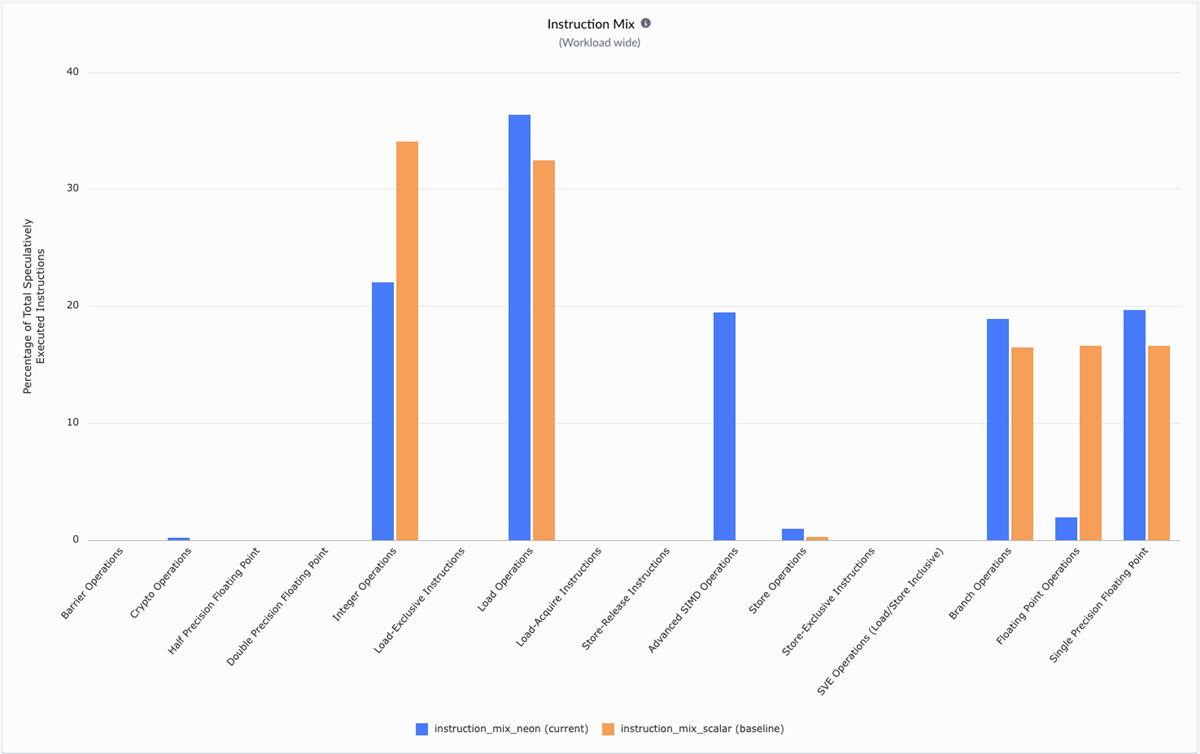
We can compare the new Instruction Mix data with the scalar version, by selecting the previous Instruction Mix run:
Overlay runs to compare instruction usage before and after optimization. The optimized version shows SIMD instructions, while scalar operations decrease, indicating more work done per instruction. While the scalar version is dominated by integer, floating-point and load operations, the NEON version introduces vectorization with Advanced SIMD. Vectorizing the loop reduces the number of instructions required per element, directly relieving frontend pressure.
The payoff – removing the frontend bottleneck
Re-running the CPU microarchitecture recipe shows that after vectorization, frontend stalls drop significantly, and backend effects become dominant. The change is dramatic:
- Frontend bound drops from about 60% to about 11%
- Backend bound increases to about 63%
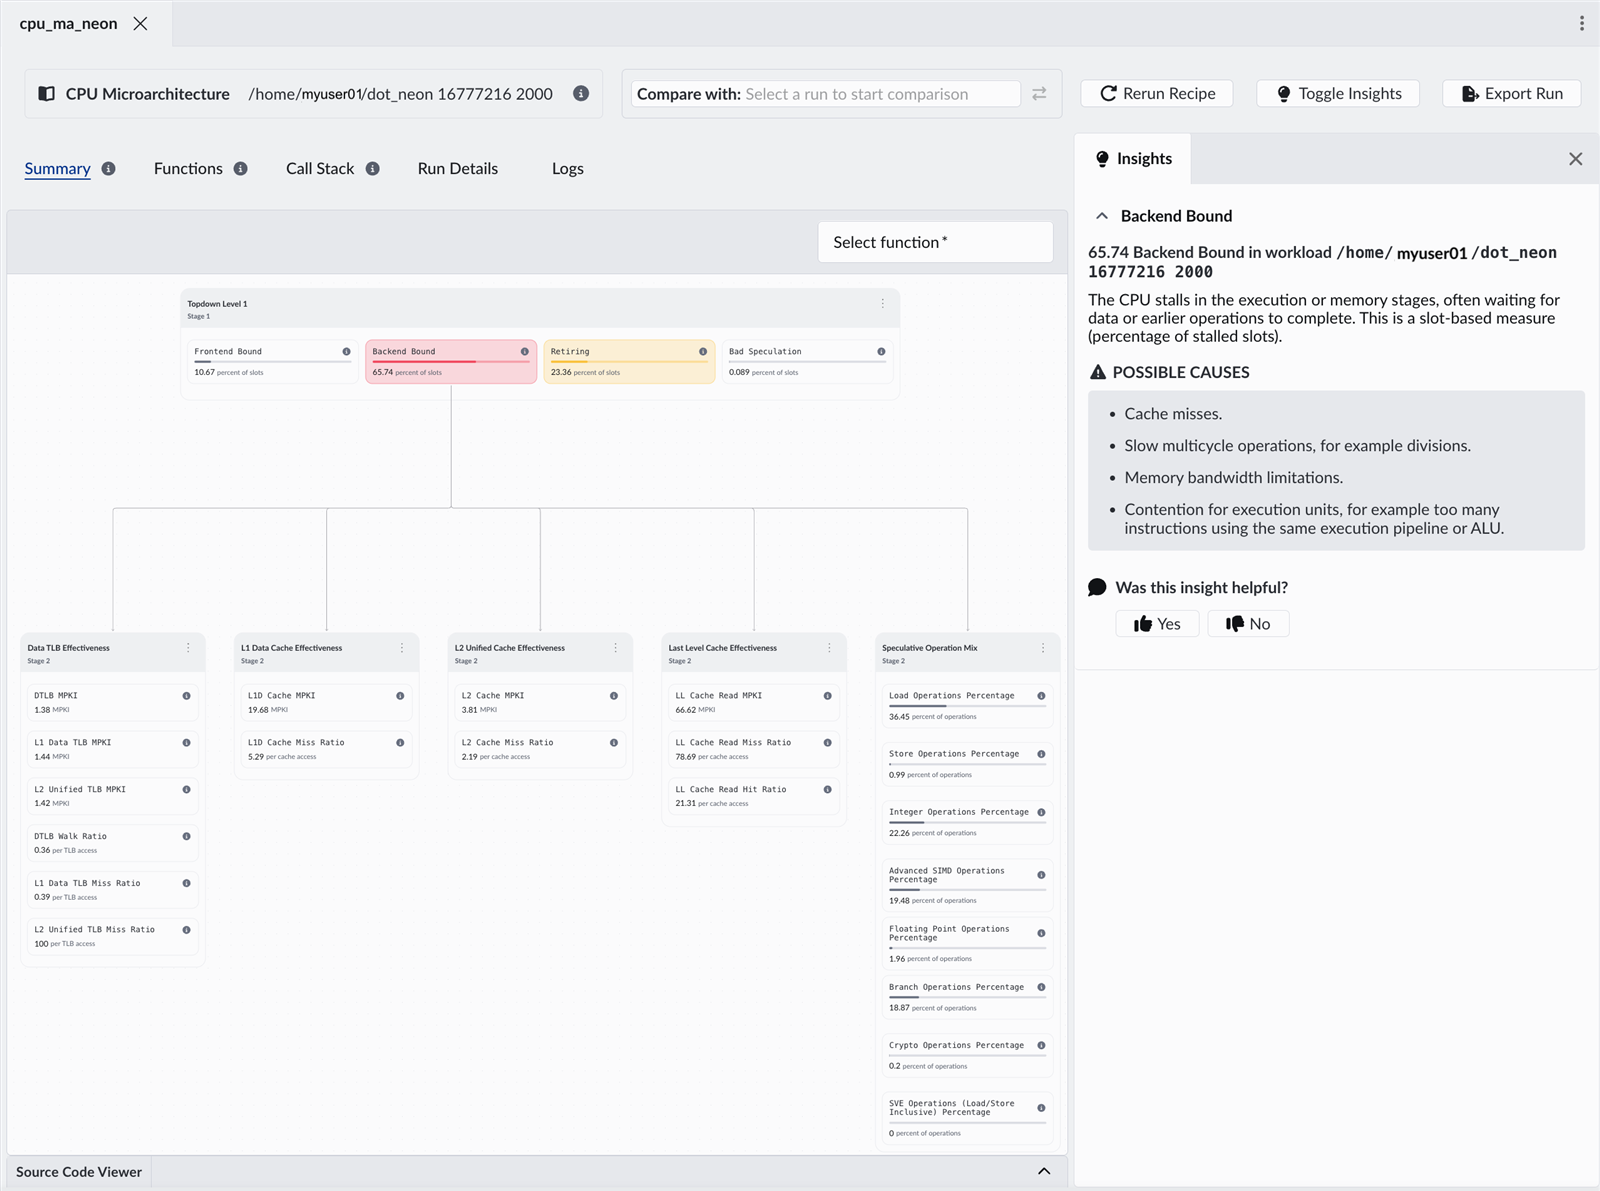
The optimization does not only improve performance, it shifts the bottleneck. Instruction supply is no longer the limiting factor. The CPU executes more efficiently and demand shifts to execution units and memory.
This is a valuable insight for real workloads. When one bottleneck is removed, the next becomes measurable. Performix supports iterative investigation: measure, change, and validate. It guides you from bottleneck identification to root cause.
Final takeaway
This example demonstrates a common pattern in performance optimization: improving one part of the pipeline increases pressure elsewhere.
Performix makes this process systematic. You can identify where time is spent, determine the cause, and validate improvements within a single workflow.
Performance analysis is becoming more important as workloads evolve. Cloud and AI systems now consist of interacting services, frameworks, and increasingly autonomous agents rather than single applications. In these environments, you need to measure and maximize useful work across the entire system.
Tools must therefore answer a different question. Not only “where are cycles spent?” but also “how efficiently does the system perform useful work?”
Arm Performix supports this shift by combines hardware telemetry with structured analysis and comparison workflows to help you identify inefficiencies and scale workloads on Arm-based platforms.
These principles become more critical as compute evolves toward platforms such as the Arm AGI CPU, where efficiency must be optimized across entire systems and many concurrent agents.
Getting started
Performix is free to use and available for all Arm-based platforms. After installation, you can connect to a target system, select a recipe, and begin collecting performance data within minutes.
Start exploring your own workloads with Arm Performix and see where your system can do more with the same resources.

By Julie Gaskin
Re-use is only permitted for informational and non-commercial or personal use only.
