Gain up to 36% performance benefits for deploying Elasticsearch on Alibaba Cloud Yitian 710 instances
This blog post highlights that G8Y outperforms G7, showing up to a 36% improvement in Elasticsearch performance on Alibaba Cloud Yitian 710 instances.

Elasticsearch is a powerful, open-source, distributed search and analytics engine known for its speed, scalability, and flexibility. It is widely used for various purposes, including full-text search, logging and log analysis, real-time analytics, and more. Its popularity extends significantly to cloud environments.
The http_logs track is a standard dataset and workload used in Elasticsearch's Rally benchmarking tool. It simulates typical web server log data, making it ideal for evaluating Elasticsearch performance in scenarios involving log data ingestion and analysis.
In this blog post, we compare the performance of the Elasticsearch http_logs track test case on two types of Alibaba Cloud Elastic Compute Service (ECS) instances: ECS g8y (powered by Yitian 710 processors based on Arm Neoverse N2 architecture) and g7 (powered by 3rd Generation Intel Xeon Scalable processors). Our findings reveal that the Elasticsearch http_logs track test case on g8y instances can achieve up to a 36% performance advantage over g7 instances. The following sections detail our testing methodology and results.
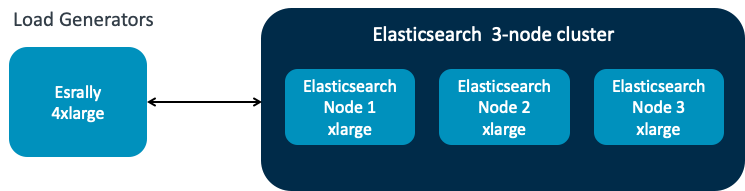
Test environment:
The test requires three xlarge instances running the Elasticsearch server and one 4xlarge instance running the esrally benchmark. Both g8y and g7 cloud instances are deployed with the same vCPUs and memory, running the same OS and Elasticsearch/esrally software versions and configurations.
Hardware Information:
| Alibaba instances | Processor | vCPUs | DRAM(GB) | Disk(GB) |
| g8y.xlarge | Yitian 710 | 4 | 16 | 200 |
| g8y.4xlarge | Yitian 710 | 16 | 64 | 200 |
| g7.xlarge | Intel Ice Lake | 4 | 16 | 200 |
| g7.4xlarge | Intel Ice Lake | 16 | 64 | 200 |
Software Versions and Settings:
| OS | Alibaba Cloud Linux 3.2104 LTS 64-bit |
| Elastic Search | 8.7.1 |
| esrally | 2.11.0 |
| Java | openjdk-17.0.10 |
| JVM | “-Xms8g -Xmx8g -XX:+UseG1GC” |
Benchmark esrally Settings:
| track | http_logs |
| pipeline | benchmark-only |
| target-hosts | node1:9200,node2:9200,node3:9200 |
| challenge | append-no-conflicts |
| include-tasks | delete-index,create-index,check-cluster-health,index-append,hourly_agg |
| track-params | "index.number_of_shards":12 |
| "index.translog.durability":"async" | |
| "index.refresh_interval":"10s" | |
| "index.translog.flush_threshold_size":"1024mb" | |
| "bulk_indexing_clients":20 | |
| "bulk_size":5000 |
Test results
To minimize testing errors, we performed multiple tests (approximately 10 times), and the final data presented is the average of these results.
The test results show that the G8Y index-append throughput is over 36% higher than G7 across the min, mean, median, and max metrics, with p50 and p90 service times approximately 30% shorter. The p99 to p100 service times are like to those of G7. Furthermore, for hourly_agg at the same 0.20 ops/s throughput, G8Y's service time is more than 27% shorter than G7 across the p50, p90, p99, and p100 metrics.
| track | Metric | Task | unit | G8Y | G7 | Performance improvement |
| http_logs | Min Throughput | index-append | docs/s | 507769.07 | 361915.36 | 40.30% |
| Mean Throughput | index-append | docs/s | 532449.65 | 381351.57 | 39.62% | |
| Median Throughput | index-append | docs/s | 532328.58 | 375495.82 | 41.77% | |
| Max Throughput | index-append | docs/s | 559808.89 | 410070.47 | 36.52% | |
| 50th percentile latency | index-append | ms | 182.75 | 258.71 | 29.36% | |
| 90th percentile latency | index-append | ms | 282.82 | 408.34 | 30.74% | |
| 99th percentile latency | index-append | ms | 670.78 | 699.52 | 4.11% | |
| 99.9th percentile latency | index-append | ms | 2786.91 | 2773.83 | -0.47% | |
| 99.99th percentile latency | index-append | ms | 3580.11 | 3706.09 | 3.40% | |
| 100th percentile latency | index-append | ms | 4291.42 | 4411.63 | 2.72% | |
| 50th percentile service time | index-append | ms | 182.75 | 258.71 | 29.36% | |
| 90th percentile service time | index-append | ms | 282.82 | 408.34 | 30.74% | |
| 99th percentile service time | index-append | ms | 670.78 | 699.52 | 4.11% | |
| 99.9th percentile service time | index-append | ms | 2786.91 | 2773.83 | -0.47% | |
| 99.99th percentile service time | index-append | ms | 3580.11 | 3706.09 | 3.40% | |
| 100th percentile service time | index-append | ms | 4291.42 | 4411.63 | 2.72% | |
| error rate | index-append | % | 0.00 | 0.00 | NA | |
| Min Throughput | hourly_agg | ops/s | 0.20 | 0.20 | NA | |
| Mean Throughput | hourly_agg | ops/s | 0.20 | 0.20 | NA | |
| Median Throughput | hourly_agg | ops/s | 0.20 | 0.20 | NA | |
| Max Throughput | hourly_agg | ops/s | 0.20 | 0.20 | NA | |
| 50th percentile latency | hourly_agg | ms | 746.29 | 1035.48 | 27.93% | |
| 90th percentile latency | hourly_agg | ms | 772.10 | 1069.32 | 27.80% | |
| 99th percentile latency | hourly_agg | ms | 791.22 | 1095.67 | 27.79% | |
| 100th percentile latency | hourly_agg | ms | 801.38 | 1103.35 | 27.37% | |
| 50th percentile service time | hourly_agg | ms | 744.38 | 1033.88 | 28.00% | |
| 90th percentile service time | hourly_agg | ms | 770.35 | 1067.63 | 27.85% | |
| 99th percentile service time | hourly_agg | ms | 789.17 | 1093.97 | 27.86% | |
| 100th percentile service time | hourly_agg | ms | 799.56 | 1101.41 | 27.41% | |
| error rate | hourly_agg | % | 0.00 | 0.00 | NA |
G8Y's index-append throughput is more than 36% higher than G7's across the min, mean, median, and max metrics.
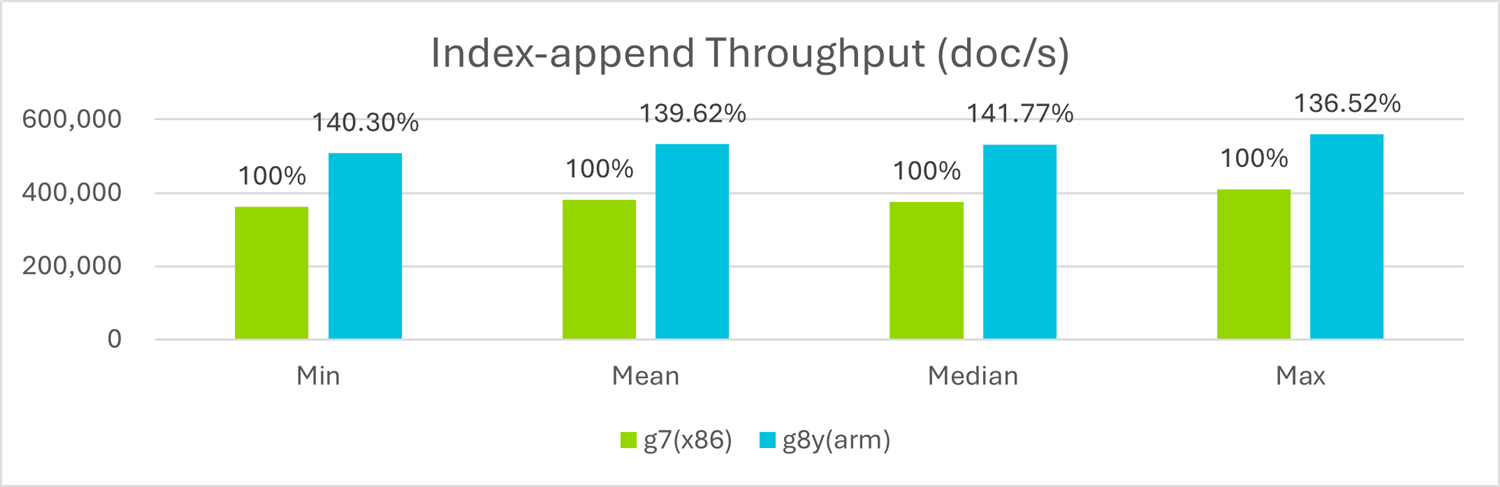
Index-append Throughput Improvement Report
G8Y's index-append service times at the p50 and p90 levels are approximately 30% shorter than G7's, while the p99 to p100 service times are similar to those of G7.
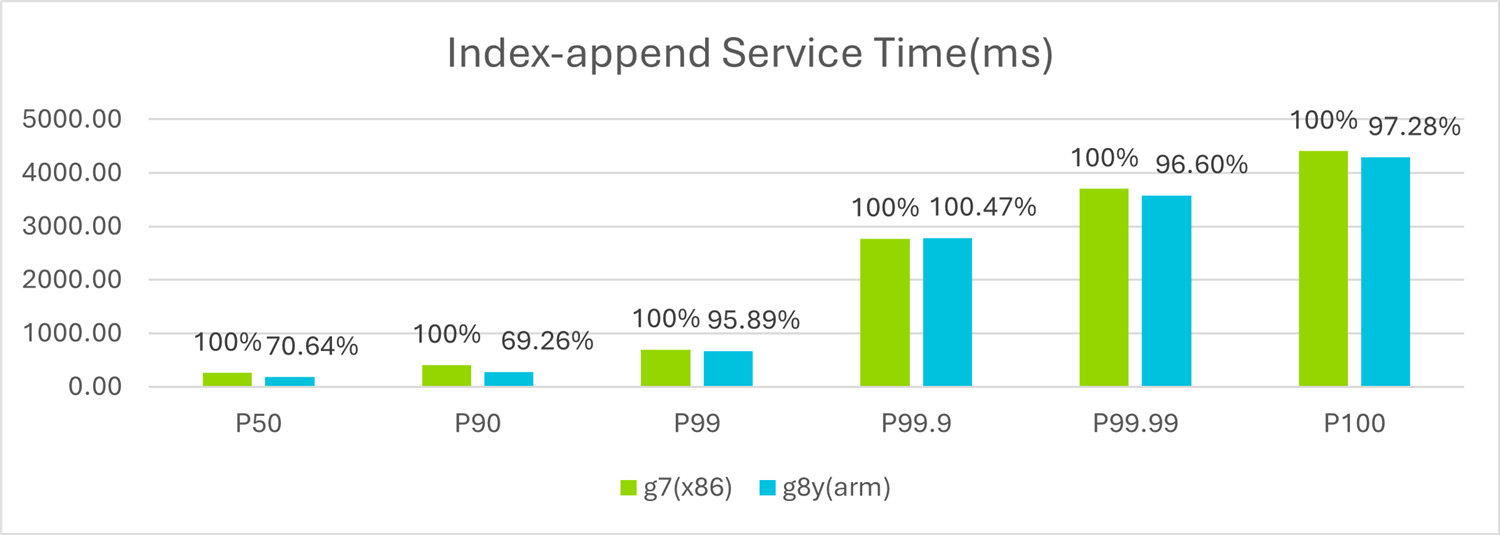
Index-append Service Time Improvement Report
When hourly_agg operates at the same 0.20 ops/s throughput, G8Y's service time is more than 27% shorter than G7's across the p50, p90, p99, and p100 metrics.
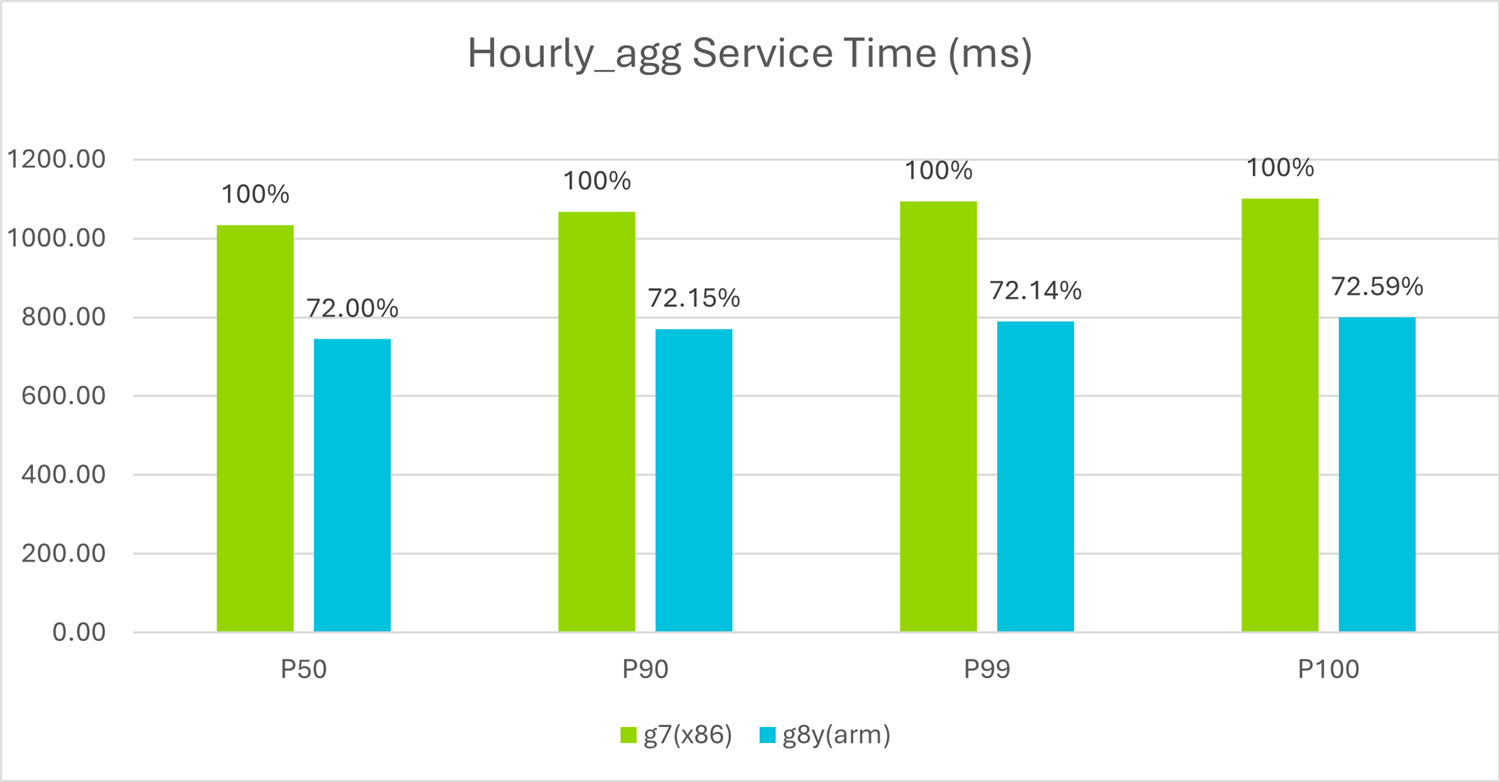
Hourly_agg Service Time Improvement Report
Conclusion
In the Elasticsearch benchmark esrally http_logs track test case, G8Y outperforms G7 with over 36% higher throughput for index-append, along with approximately 30% shorter p50 and p90 service times. Additionally, G8Y reduces service time by more than 27% across the p50, p90, p99, and p100 metrics for hourly_agg.
References

Re-use is only permitted for informational and non-commercial or personal use only.
