Create your own AMBA Viz plugins
Discover how TPL plugins extend AMBA Viz with custom hardware signal, bus, and event analysis for more flexible RTL debug and performance analysis
By Tony Nip

AMBA Viz is a hardware verification tool that enables faster debugging and performance analysis for cycle-accurate simulation and emulation, even for complex interconnects and AMBA bus protocols. It includes a set of IP and protocol plugins that extract AMBA bus messages and link them into bus transactions.
To learn more, you can read the Introduction to AMBA Viz blog post.
Did you know that AMBA Viz lets you create your own hardware analysis capabilities beyond the features available in standard plugins? AMBA Viz provides a framework for creating custom plugins that capture and query arbitrary hardware signal and events. This is useful when existing AMBA Viz plugins do not support the analysis you need, or when a plugin is not yet available for a specific IP.
Current use cases for custom plugins include:
- Analyze bus traffic on any AMBA port within a component.
- Analyze hardware signal changes, such asmicroarchitecture state changes, with timestamping.
- Create and query custom hardware events based on collections of hardware signals and their values.
You can create custom AMBA Viz plugins using TPL, a proprietary scripting language built on Apache Groovy. TPLprovides a simple, user-friendly way for engineers to rapidly create hardware signal, port, and event analysis solutions. The following example system diagram and examples show how to create TPL scripting solutions for each use case.
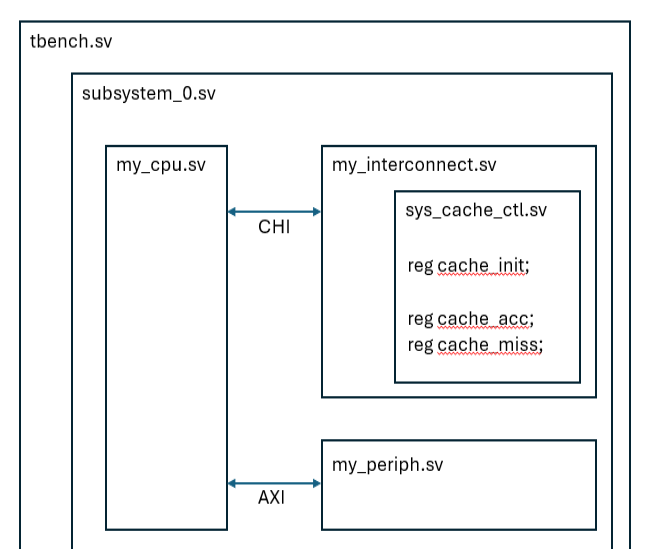
TPL port detection example
TPL port detection is useful when you need to analyze an AMBA port that is not supported by an existing AMBA Viz plugin. The following example shows a detector for the CPU’s top-level ports in the reference system diagram. This example includes an AXI peripheral port and a CHI port.
detectorId 'my_cpu_port_detector'             // Detector ID used by AMBA Viz utilities
detectorName 'My CPU Port Detector'           // Human-readable detector display name
rtlRootPath 'tbench.u_subsystem_0.u_my_cpu'   // RTL hierarchy path to component root
ttnRootName 'My CPU top-level'                // Human-readable component name for GUI

port {
   ttnPath 'My CPU Periph Port'               // Human-readable port name for GUI
   busProtocol 'AXI'
   rtlPath '*P0'                              // Matches signals such as AWADDRP0
   clockPath 'periph_port_clock'              // Relative to rtlRootPath
}

port {
   ttnPath 'My CPU CHI Port'
   busProtocol 'CHI'
   rtlPath '*M0'
   clockPath 'chi_clock'
   busOptions([                               // CHI port properties – see documentation
      'chi_issue': 'E',
      'chi_address_width': 48,
      'chi_mpam_width': 11,
      'chi_req_rsvdc_width': 0,
      'chi_dat_rsvdc_width': 0,
   ])
}
Each TPL port detector must define certain detector-level properties, such as, detectorId, and port-level properties, such as rtlPath. CHI ports also require additional bus properties for correct detection. For more information, see the AMBA Viz documentation:
<AMBA Viz install directory root>/docs/public/api/guide/tritondb/tpl-port-detection.htmlTPL signal tracking example
Bus traffic analysis often a good starting point for debugging. When deeper microarchitectural analysis is required, TPL signal detection lets you pull timestamped hardware signals into the API-queryable space.
The following example demonstrates a TPL hardware signal detector for a system cache controller. The detector provides access to internal signals that show activity such as cache initialization and accesses.
detectorId 'my_sys_cache_detector'                 // Detector id used by AMBA Viz utilities

rtlRootModule ~/u_sys_cache_ctl/, 1                // Set root to <path>.u_my_interconnect_0

detectionSignals '.*u_sys_cache_ctl.*/cache_init'  // If used, must be present for detection
miscSignals '.*u_sys_cache_ctl.*/cache_acc'        // Signals to become queryable
miscSignals '.*u_sys_cache_ctl.*/cache_miss'
Each TPL port detector must define properties that describe the component being analyzed and enable AMBA Viz to uniquely identify the detector. For more information, see the AMBA Viz documentation:
<AMBA Viz install directory root>/docs/public/api/guide/tritondb/tpl-signal-detection.htmlExample analysis: counting signal value changes
Once loaded, auxiliary signals from a TPL Signal Detector can be accessed through the API. The following Groovy script demonstrates how to analyze signal behavior by counting the number of times specific auxiliary signals transition to 1.For 1-bit signals, this corresponds to counting rising edges.
db.system.getModuleTrees("my_sys_cache_detector").each { component ->
   int cacheAccesses = component.root.findAuxiliaryVar('cache_acc')
      .valueHistory.entries.stream()
      .filter { entry -> entry.value.toInt() == 1 }
      .count()

   int cacheMisses = component.root.findAuxiliaryVar('cache_miss')
      .valueHistory.entries.stream()
      .filter { entry -> entry.value.toInt() == 1 }
      .count()

   println "Cache Accesses: ${cacheAccesses}; Cache Misses: ${cacheMisses}"
}
TPL SignalEvent example
Unlike raw signal detectors, this example focuses on event generation, enabling users to define queryable events based on one or more arbitrary hardware signals and their combined values. Such TPL plugins are created using the AMBA Viz SignalEventSpec TPL syntax.
The following example defines cache access and cache miss events. Unlike the previous TPL signal tracking examples that define the detector’s RTL root module, this example plugin provides functionality that extends an existing detector (in this case, a detector called ‘my_interconnect_detector’ with root module: tbench.u_subsystem_0.u_my_interconnect, as implied by the inheritsFrom property.
eventSpecName 'Cache Miss Event Spec'        // Human-readable detector display name
eventSpecId 'cache_miss_events'              // Detector id used by AMBA Viz utilities

module {
   inheritsFrom 'my_interconnect_detector'   // Provides extension of existing detector

   // Cache access signal
   signal {
      id 'cache_acc'                         // Pull signal into queryable space
      path '.*sys_cache_ctl.*/cache_acc'     // Relative path from module root
      type 'REGISTER'
      info 'Cache access signal'
   }

   // Cache miss signal
   signal {
      id 'cache_miss'
      path '.*sys_cache_ctl.*/cache_miss'
      type 'REGISTER'
      info 'Cache miss signal'
   }

   // Cache access event
   event {
      predicate '(cache_acc == 0x1)'         // Define what event represents
      level 'INFO'
      info 'Cache access detected'
   }

   // Cache miss event
   event {
      predicate '(cache_acc == 0x1 && cache_miss == 0x1)'
      level 'INFO'
      info 'Cache miss detected'
   }
}
Each TPL SignalEvent plugin must define properties that describe the signals used by the event and how their values define a queryable event. For more information, see the AMBA Viz documentation:
<AMBA Viz install directory root>/docs/public/api/guide/tritondb/tpl-events.htmlQuerying hardware events via the AMBA Viz API
Once loaded, you can query events generated by a TPL SignalEvent plugin through the AMBA Viz API. The following Groovy script prints all events detected by the cache_miss_events example plugin.
def events = db.getEvents('cache_miss_events')

events.each { event ->
    println event.toString()
    println event.info + '; ' + event.eventType + '; ' + event.eventLevel
}
Installing TPL plugins
To install a TPL plugin, place the script in a directory that AMBA Viz scans at runtime. The following sections describe the requirements for TPL port detectors, signal detectors, and SignalEvent plugins.
Installing TPL port detectors and TPL signal detectors
Create the following directory in your home folder and copy your detectors there:
mkdir -p ~/.tritondb/tpl/detectors/You can also set the $SHARED_TRITONDB_HOME environment variable to point to a shared directory. This enables multiple users to access the same set of detectors instead of using ~/.tritondb.
Once installed, you can access TPL detectors in the following ways:
- In AMBA Viz, under User TPL Plugins when loading waveforms.
- Via the triton-gvy utility using the -d (detector) argument.
Installing TPL SignalEvent plugins
Create the following directory in your home folder and copy your detectors there:
mkdir -p ~/.tritondb/tpl/signalEvents
Note: TPL SignalEventSpec plugins are automatically loaded when the parent detectors they extend are loaded, requiring no additional user action.
Support
As you explore how AMBA Viz TPL solutions can support your RTL debugging capabilities, contact support-ambaviz@arm.com with technical queries, for example aboutsyntax or use cases.
Haven't used AMBA Viz before? AMBA Viz is part of the Arm Hardware Success Kit, so if you have the Hardware Success Kit, you already have access to AMBA Viz. The installation instructions are available from Arm Learning Paths to help you get started.
If you do not have the Hardware Success Kit and you would like to try AMBA Viz, send an email to license.support@arm.com to request an evaluation.

By Tony Nip
Re-use is only permitted for informational and non-commercial or personal use only.
