Profile neural graphics workloads with Arm Streamline
New Mali timeline and Dispatch graph views connect Vulkan submission, NX execution, shader activity, and system performance in one analysis workflow
By Julie Gaskin

Arm Mali G2-Ultra NX, Arm’s latest GPU, introduces dedicated Neural Accelerators that enable high-performance AI and neural graphics workloads. Arm Streamline 9.9 adds profiling support for these workloads, connecting graph creation and dispatch with GPU hardware execution. Streamline helps developers identify latency, expensive graph operations, and shader fallbacks in applications that use the ML extensions for Vulkan. You can also see their impact across the full system. Streamline is available free as part of Arm Performance Studio.
Use cases for neural workload profiling
Streamline can profile workloads that use Arm Neural Technology such as Neural Super Sampling (NSS) and Neural Frame Rate Upscaling (NFRU). Streamline places these neural workloads alongside rendering and other graphics operations. This helps developers understand their effect on frame time. Combined with Mali GPU performance counters and optimization guidance, this information can reveal bottlenecks and help recover frame-rate headroom.
Developers can also inspect models running on the GPU. Streamline provides aggregate statistics, including per-instance execution time. You can use these metrics to measure performance and establish model budgets. Per-operation views provide a more detailed breakdown of execution. This helps developers identify expensive operations and potential optimizations, such as quantization.
Why neural graphics profiling needs system context
A neural graphics workload can involve graph compilation, Vulkan queue submissions, execution on dedicated neural hardware, shader-core work, and conventional graphics activity. A frame-time measurement can show that an application exceeded its frame-time budget. However, it cannot explain which stage was responsible or whether unrelated GPU work contributed to the delay.
Streamline 9.9 addresses this by adding neural graphics information to two complementary views. The Mali Timeline shows when work was submitted and executed alongside the rest of the system. The new Dispatch Graph Workloads view breaks a graph down into the operations and commands that consumed the time. Developers can move between these views to connect an expensive operation with its place in a frame or application workflow.
See graph work in the Mali Timeline
The updated Mali Timeline displays Data Graph pipeline creation, session creation, and vkCmdDispatchDataGraph commands alongside other GPU work. For workloads with neural and shader operations, separate streams show how execution is distributed between Mali NX hardware and the shader cores. Selecting a workload shows the available NX statistics in the workload information panel.
This view answers the timing questions that are difficult to resolve from graph statistics alone. You can:
- measure the delay between dispatches
- identify overlap with rendering
- inspect whether CPU activity or thread placement contributed to a gap in GPU execution.
Pipeline creation events also show long compiler activity. This information can help you identify opportunities to create or cache pipelines earlier.
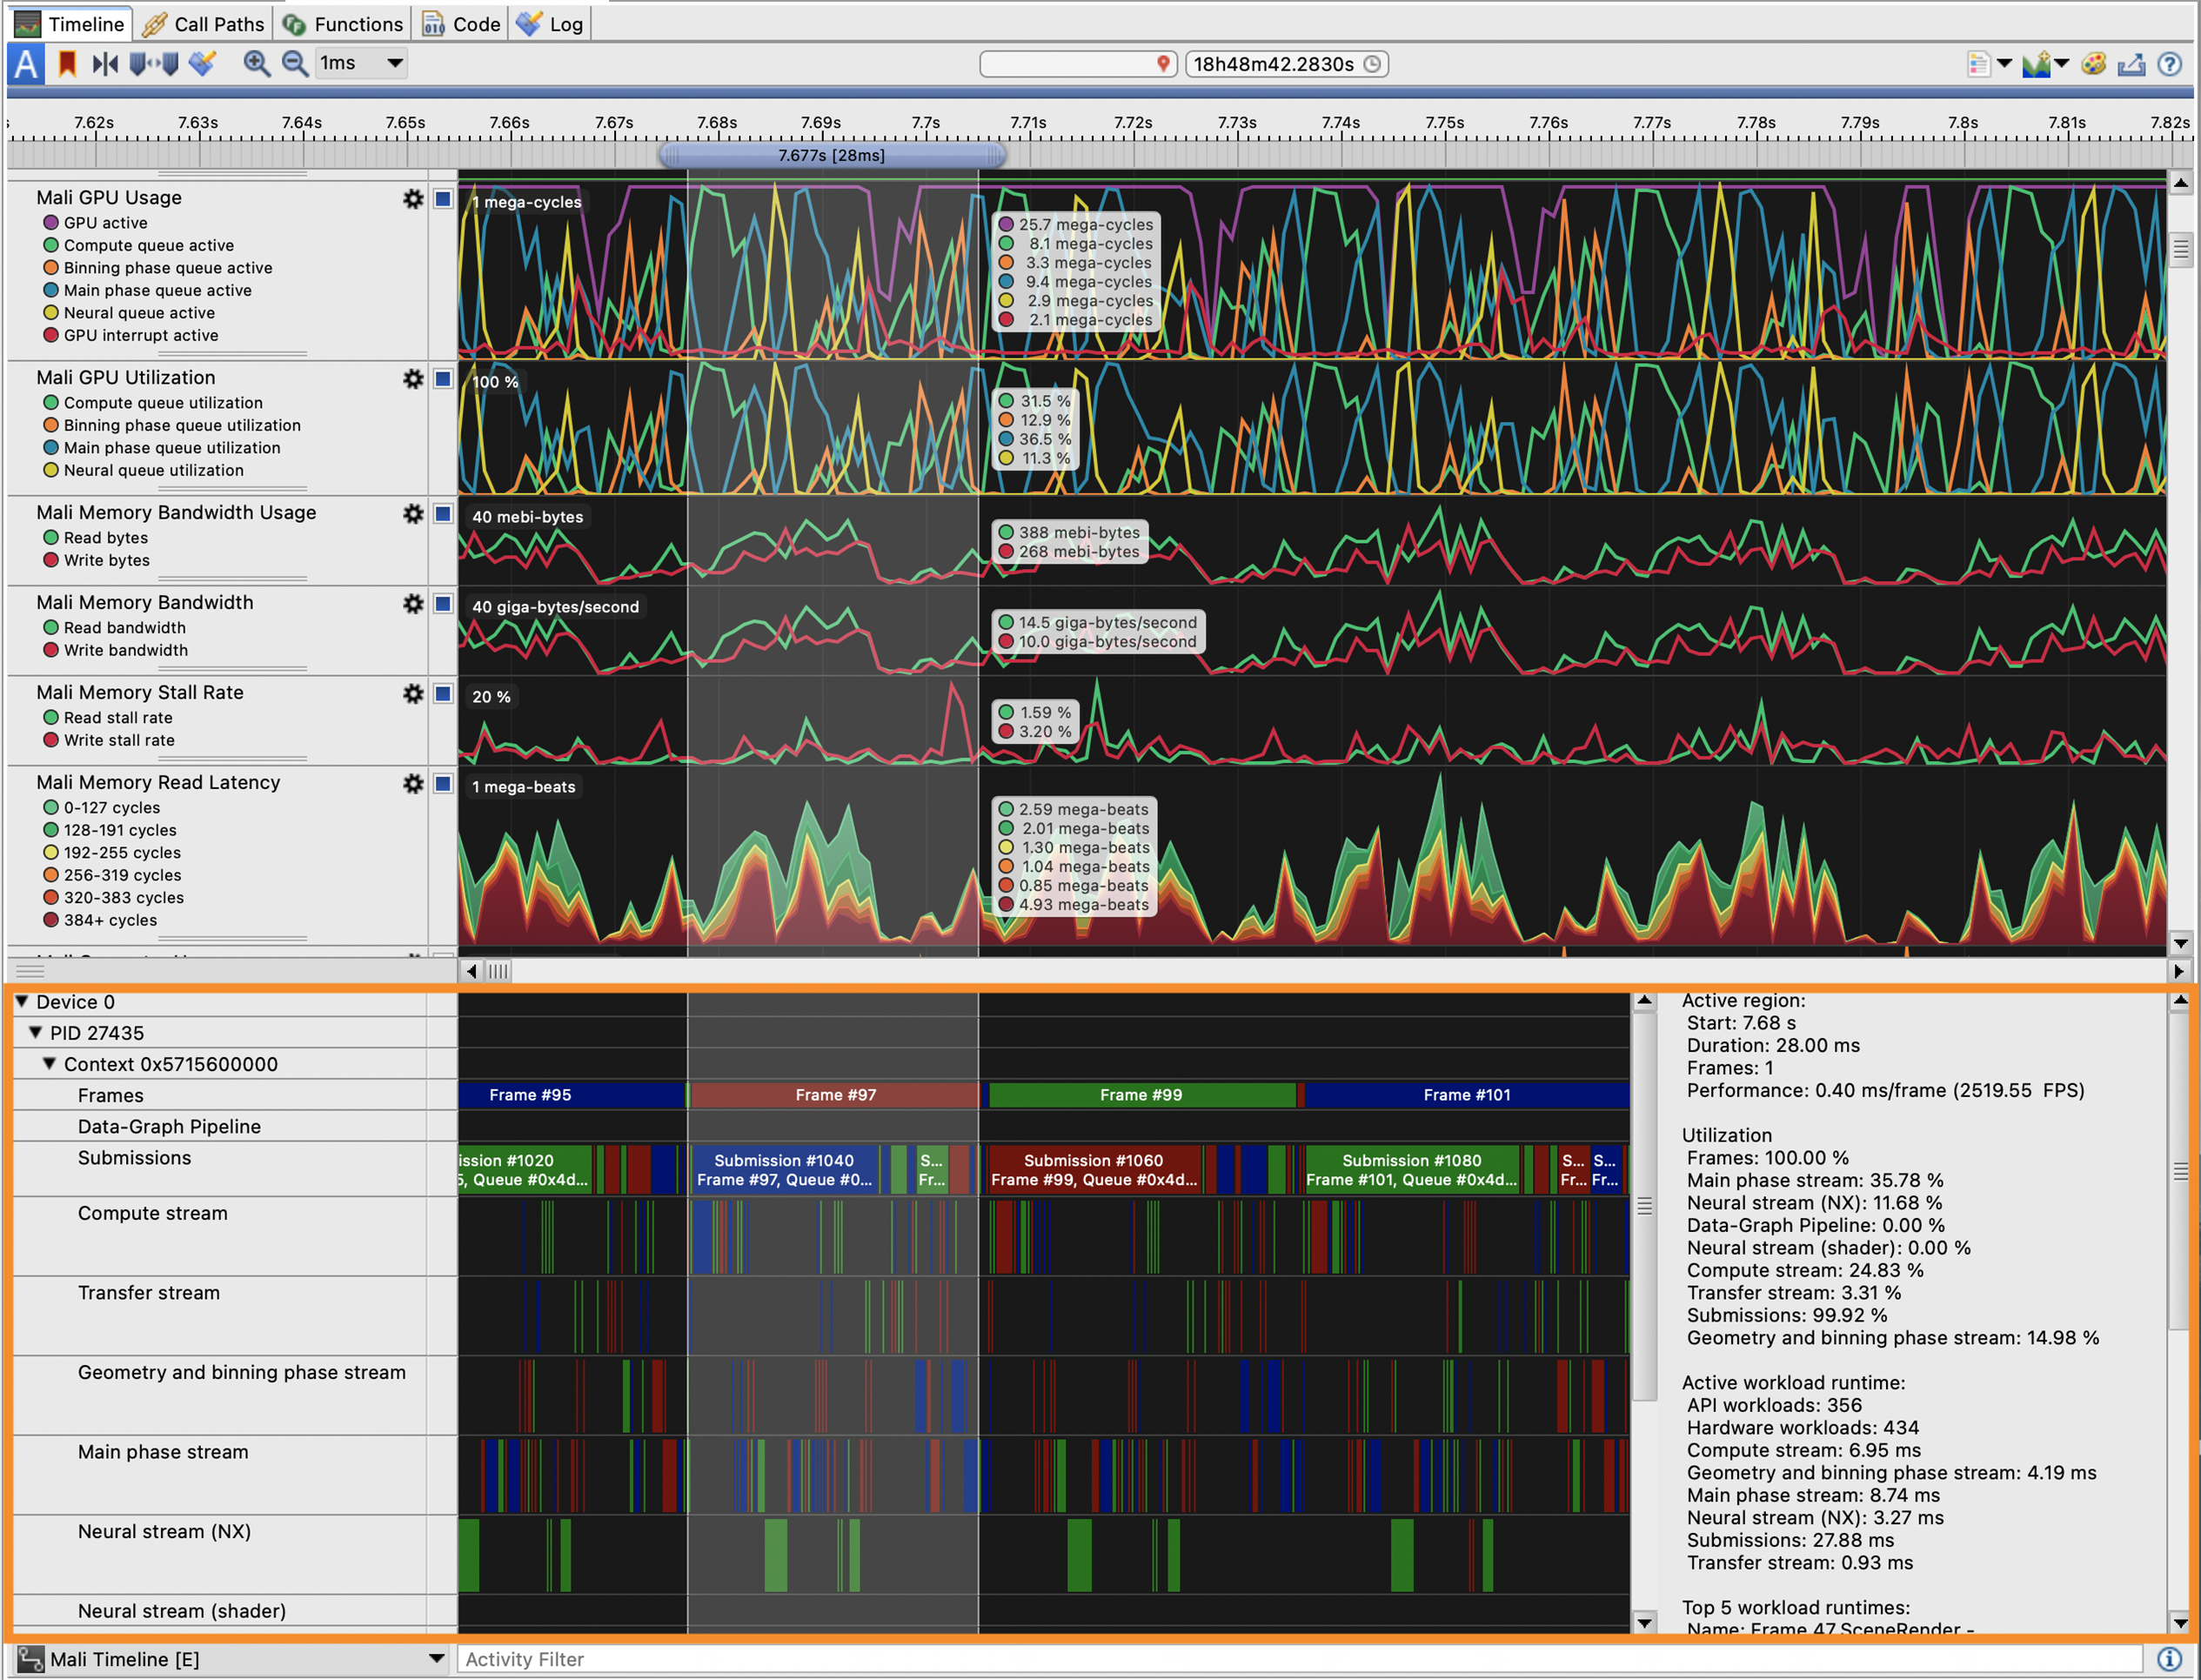
Figure 1 - A neural graphics workload in the Mali Timeline
Inspect the data graph
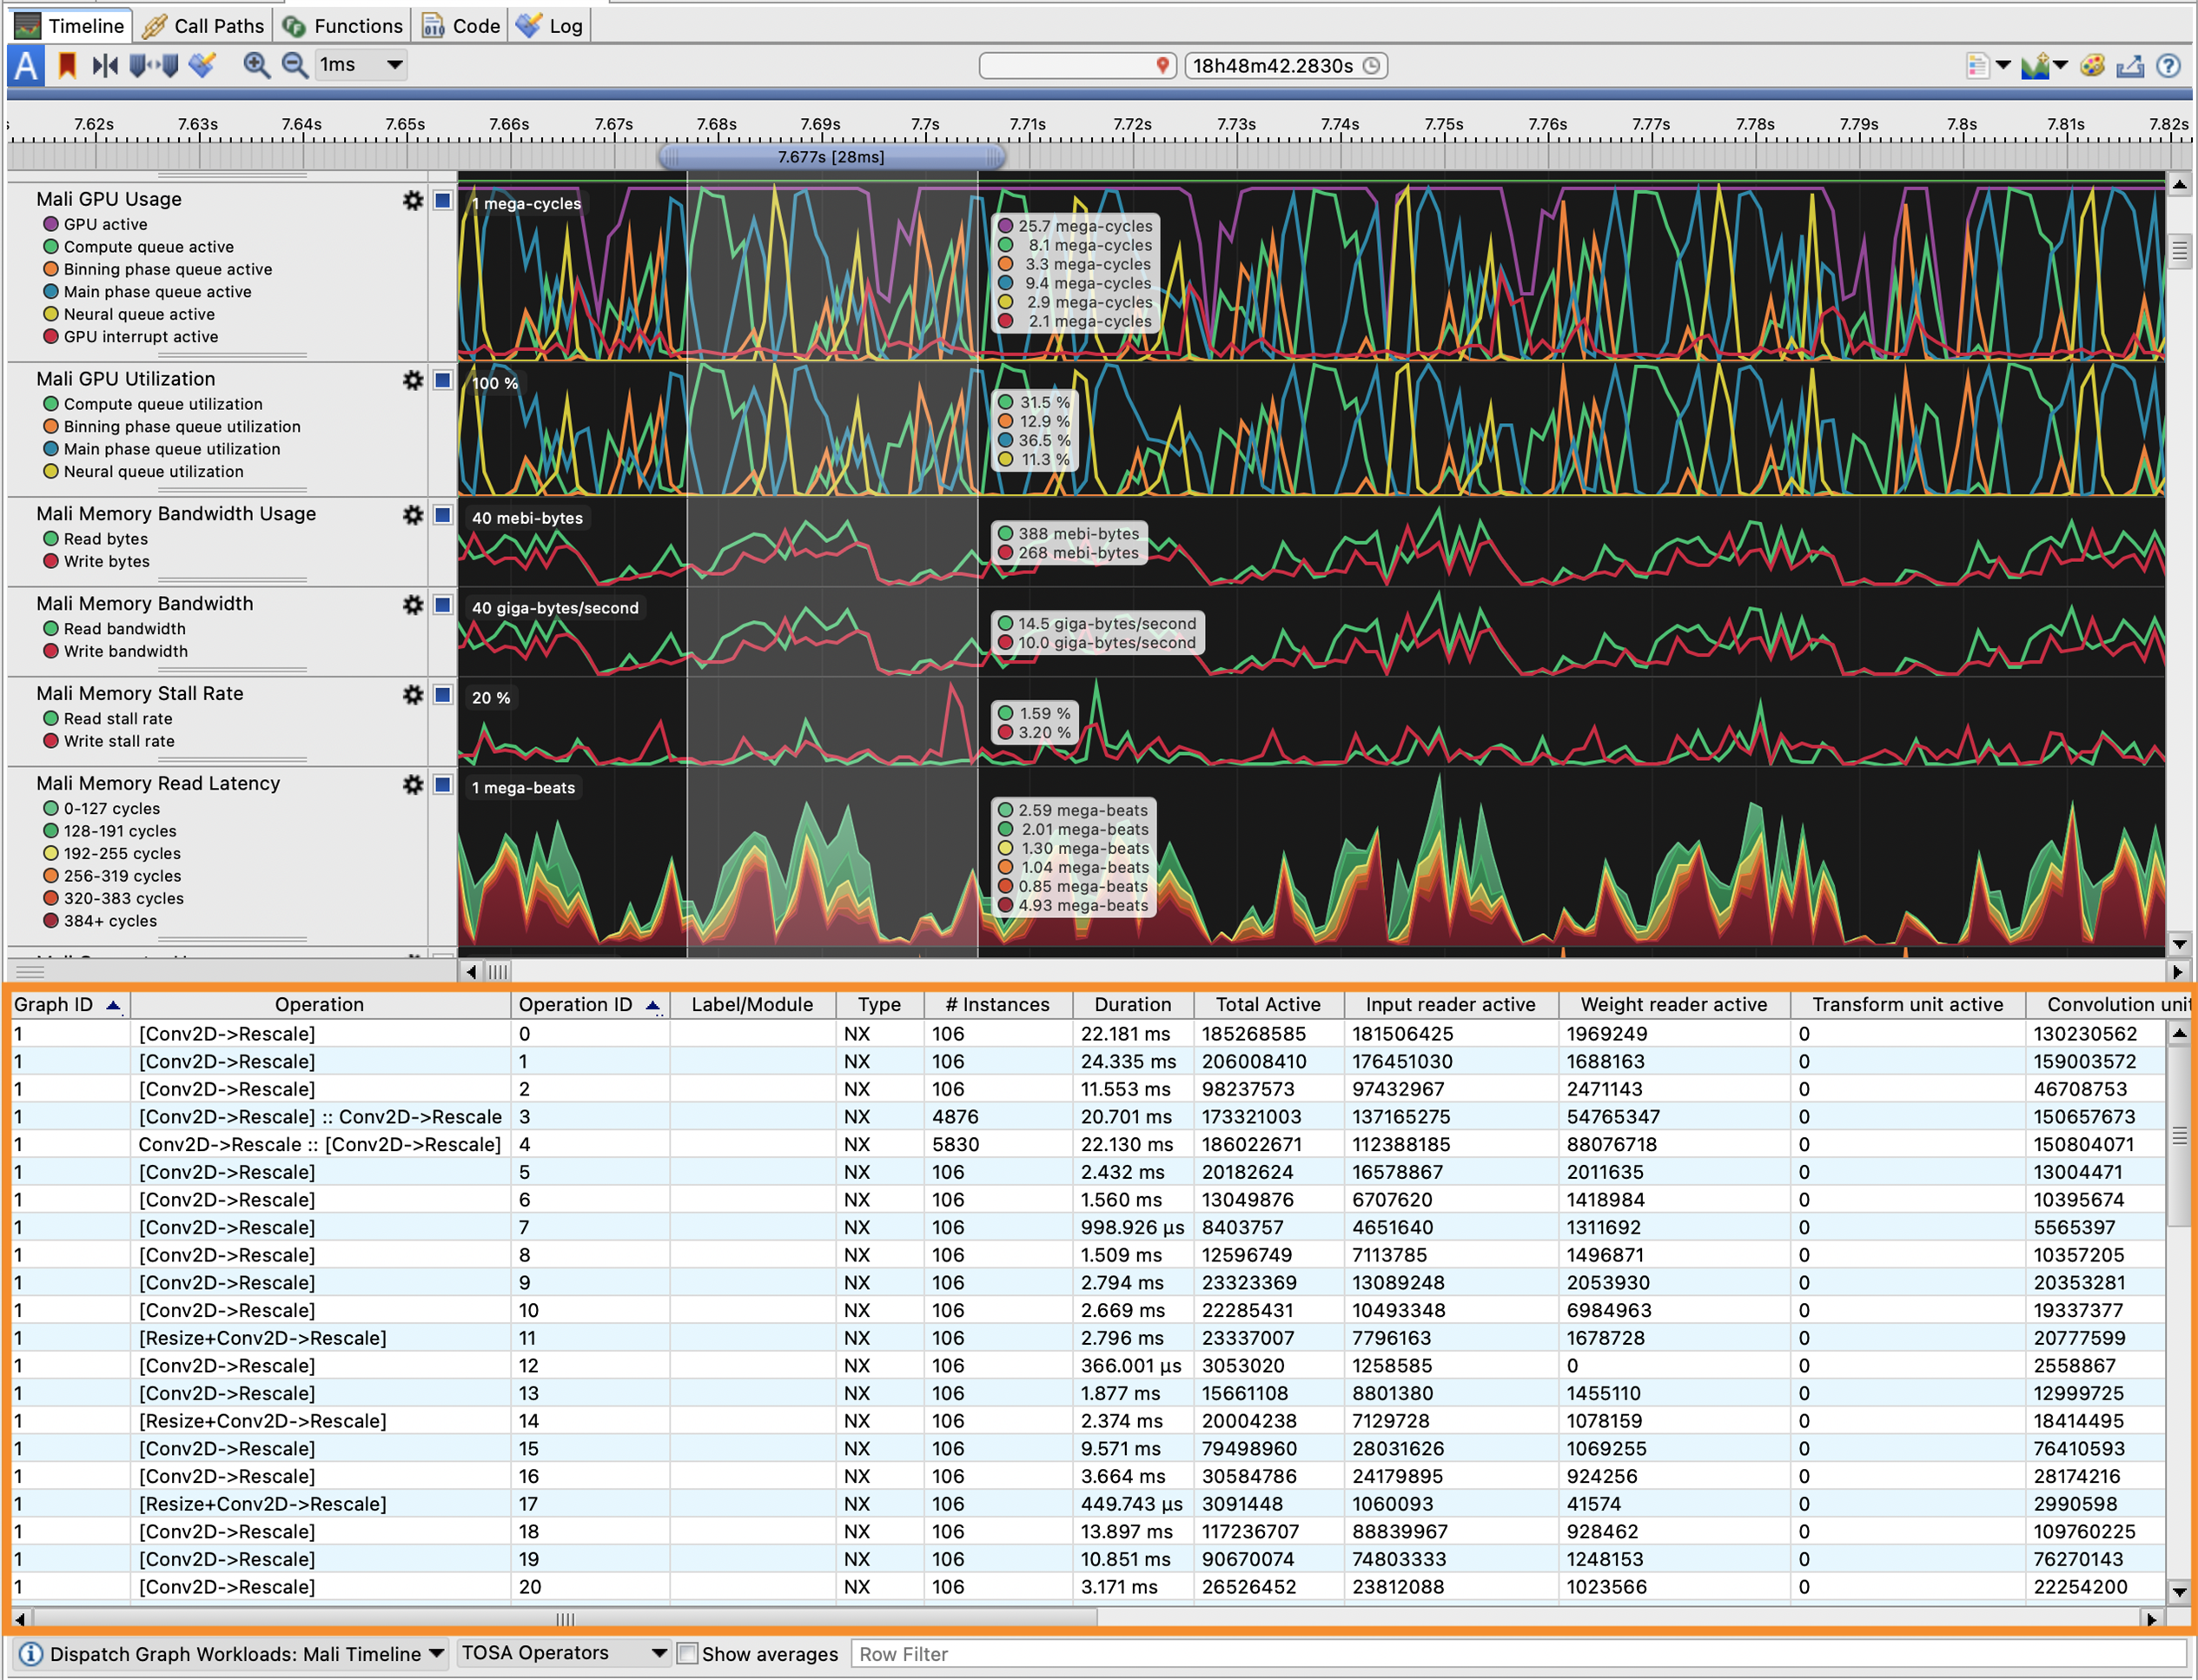
The Dispatch Graph Workloads view presents aggregated execution statistics for captured neural graphics workloads. It focuses on the internal graph structure rather than its position in the wider system. Duration and hardware metrics help identify expensive operations, underused hardware units, and stalls. They also show work that executed on shader cores instead of Mali NX hardware.
The view can aggregate data at several levels. Each level supports a different stage of the investigation.
|
Aggregation |
Question it helps answer |
|
Operation |
Which graph operations are consistently expensive across command instances |
|
Graph |
How do multiple models in the same capture compare |
|
Session |
How do graph sessions and their total statistics compare |
|
Instance |
Which individual DispatchDataGraph commands are outliers |
|
Command |
How does each operation map to NX hardware and shader commands |
A context menu action links a table entry to its corresponding item or region in the Mali Timeline. This enables you to visualize execution over time. You can also cross-reference workload execution against the global GPU counters to spot potential bottlenecks.
Move from a slow frame to a specific operation
A typical investigation starts with a frame, dispatch, or interval that missed its performance target. The following workflow connects the analysis to both the application timeline and the graph implementation.
- Capture GPU performance metrics and include Mali Timeline events.
- Open the Mali Timeline and use the cross-section marker to select the slow interval. Review pipeline creation, queue submissions,
DispatchDataGraphactivity, and the NX and shader streams. - Open Dispatch Graph Workloads and begin with operation aggregation to find the largest contributors to execution time. Check the execution target and hardware metrics for expensive operations. Shader execution may identify a graph operation that did not run on Mali NX hardware.
- Switch to instance aggregation to determine whether the cost is consistent or limited to an outlier dispatch.
- Navigate back to the corresponding timeline item and check for concurrent graphics work, CPU pressure, or gaps between submissions.
- Apply the relevant change, such as graph restructuring, quantization, tuning, or improved pipeline caching, and repeat the capture.
Refer to the following topics in the Streamline User Guide for more information:
Export graph data for automated analysis
Streamline 9.9 extends the Streamline -report command-line option to export Dispatch Graph Workloads data as CSV. A single report command can export multiple aggregations. You can use this data for performance dashboards, regression checks, and comparison across builds.
<path-to-streamline>/Streamline -report \-data-graph=by-operator.csv operator \-data-graph=by-instance.csv instance \-o results <path-to-capture.apc>
Start profiling with Streamline
The Mali Timeline and Dispatch Graph Workloads views connect application timing with graph execution. Together they help developers:
- locate expensive operations
- understand whether work ran on Mali NX hardware or shader cores
- decide where graph optimization will have the greatest effect.
Download Arm Streamline for free, as part of Arm Performance Studio.

By Julie Gaskin
Re-use is only permitted for informational and non-commercial or personal use only.
