From plausible to profile-grounded: Evaluating Dynamic Insights in Arm Performix
Dynamic Insights connects Arm Performix run data to coding agents through MCP. Here is how we test that the generated performance advice is not just plausible, but grounded in profile evidence
By Dave Rigby

The Performix team recently introduced Dynamic Insights which exposes Arm Performix run data to coding agents such as Codex and Claude Code through the Performix MCP server.
The Model Context Protocol (MCP) makes it straightforward to expose profiler data to a range of coding agents. However, MCP does not automatically make an agent's advice trustworthy. LLMs can produce plausible-sounding performance advice, however, we need better than just plausible advice. We want to know whether the advice is accurate, useful, and verifiable. Each recommendation must be backed by evidence from the Performix run.
This blog post explores the challenges of evaluating and testing Dynamic Insights, and how it differs from testing non-AI features.
One workload is not a test suite
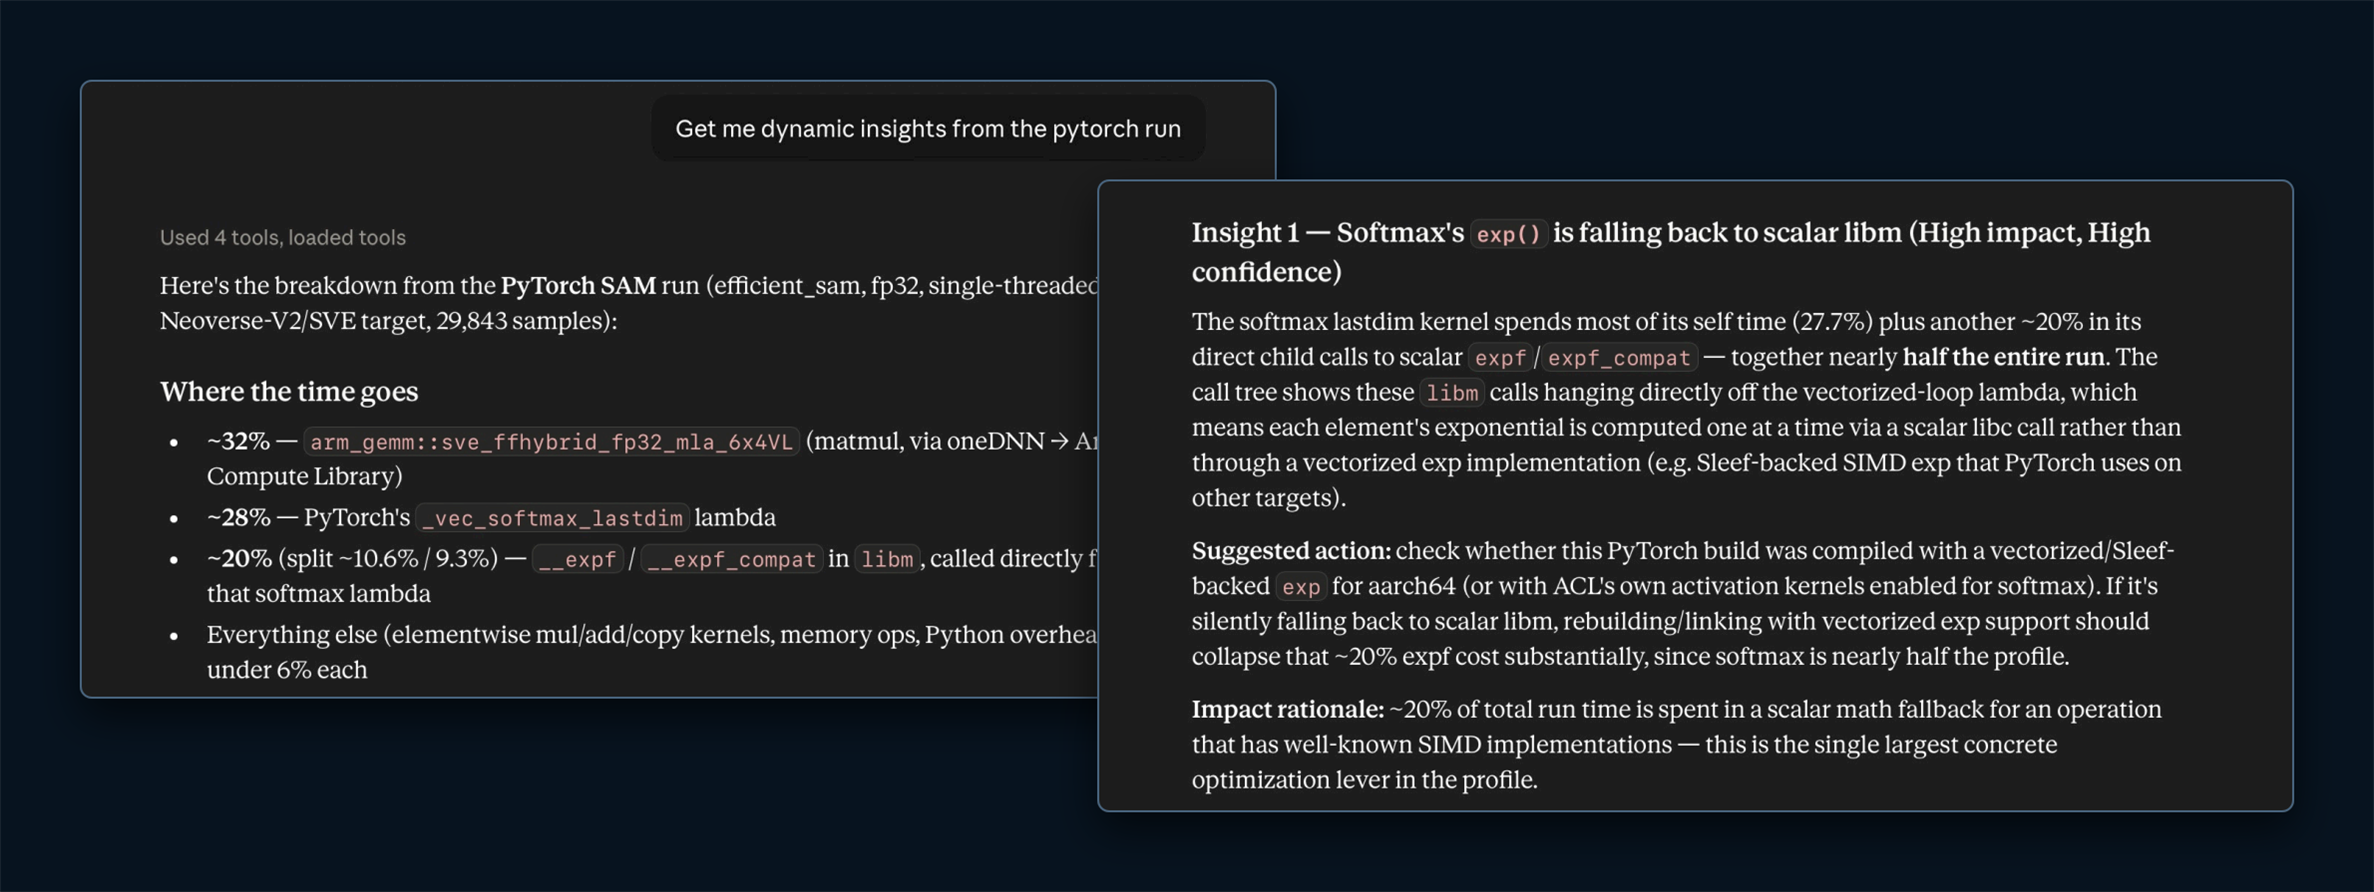
A single good response from the LLM can be useful, but it does not tell us how effective Dynamic Insights is overall. The workload might be simple enough that it does not require runtime profiling data. Alternatively, the model might already know the answer from its training data. To build confidence in Dynamic Insights, we need test cases that cover different programming languages, workload types, and performance problems.
When designing the test cases, we asked two questions: Which performance problems can Performix identify from runtime data? Which of those problems can an LLM turn into useful remediation advice? We started with small, artificial programs that highlighted a single performance problem with a clear signal. These programs supported initial bring-up, fast smoke testing, and isolating of individual performance problems. Examples of the issues tested include:
- Not using Arm SIMD extensions such as NEON or SVE.
- Missing Arm intrinsics like CRC32.
- Using x86-centric atomic memory operations.
- Using older JVM versions lacking support for newer Arm features.
We designed these tests so that their performance problems remained hidden until execution and profiling. Analyzing the source code alone was not sufficient. There are 3 reasons for this approach. Firstly, we are testing Performix which is a runtime performance analysis tool. Performance problems that can be identified through static analysis are less relevant. Second, we want to evaluate how well the LLM interprets profiling data rather than source code alone. Third, developers do not always have access to source code when profiling a workload, so it is useful to understand how well Dynamic Insights performs in that situation.
We later added test cases that were closer to real software: larger applications, external workloads, and performance problems observed while testing Performix.
We also wanted to cover a range of programming languages. We had 2 reasons for this. First, JIT-compiled languages such as C# and Java require different profiling techniques from statically compiled languages such as C++ and interpreted languages such as Python. Second, we wanted to evaluate how well the LLM reasons about different programming languages. In our testing, frontier models performed well across all the languages we evaluated.
Less determinism, more problems
We now have a set of test cases, but the next question is how to measure the LLM-generated insights. Do they identify the expected problem? Do they support their findings with evidence? Is the proposed action correct?
For the first few test cases, we evaluated the results manually. A reviewer assessed each generated insight, its supporting analysis, and its recommendations to determine whether they were correct. This approach worked initially because we were still developing the profile summary and prompt guidance for the LLM. Errors and omissions were usually easy to identify.
However, we knew this was only a temporary approach. As the test corpus and Dynamic Insights logic grew, manual review would not scale. It would also prevent automated CI testing because we cannot rely on a reviewer to inspect the output of every GitHub pull request workflow.
What were the challenges in automating this evaluation? The main challenge was non-determinism. Computers excel at processing structured, deterministic outputs, but the system we are building relies on an LLM, so its output is inherently non-deterministic.
The first challenge involved the input data. Most profilers, including Performix, use statistical sampling, so profiling the same workload twice does not produce identical profiles. The overall shape should be similar, but exact sample counts will differ, and that can change the ordering of hot functions or call-paths between runs.
The LLM response is also non-deterministic. Even with the same prompt and context, an LLM can vary the wording, phrasing, and order of its response. Two correct responses might use different supporting evidence while identifying the same underlying problem. A weak response might identify the correct function but fail to explain why it is expensive or recommend an appropriate next step.
These factors make traditional testing approaches, such as golden references and keyword matching, a poor fit. We need an evaluation method that can handle this variation while still classifying each result as pass or fail.
Making profile input repeatable
The non-determinism of the input profile is relatively simple to address. Arm Performix includes import and export features that enable us to create pre-recorded runs. We run each test workload once, export the resulting Performix run, and archive it to object storage. The evaluation test suite then imports the archived run and uses it as the input run for Dynamic Insights.
This approach gives each test case an identical input. It also speeds up testing for larger workloads because we do not need to profile the workload each time.
LLM-as-a-Judge
Although the input is now fixed, the LLM still generates free-form text that varies from run to run, even for identical inputs. We need an evaluation method that interprets the semantic meaning of the LLM response and assess whether it meets our expectations, much like a human reviewer.
How do we solve this problem? With another LLM, of course! We pass the AI-generated insight from the first LLM to a second, independent judge LLM. We also provide the judge LLM with a per-test rubric for each test case. The rubric describes the expected performance problem, the supporting evidence that should be identified, and the recommendations that should be made. The rubric also defines the pass and fail criteria by specifying which elements must be present or absent.
This approach makes the evaluation closer to a human review. Different wording is acceptable, but responses should fail if they miss the real hotspot, provide only generic tuning advice, or recommend an unrelated fix.
However, the judge LLM introduces another source of non-determinism. The rubric therefore requires its own testing and calibration. If the rubric is too permissive, weak responses can pass. If it is too strict, strong responses can fail because they use different wording or rely on different supporting evidence. In practice, each rubric required several rounds of manual tuning before it produced reliable results.
The evaluation loop
At this point, we have the main components of the test harness: a corpus of test cases, pre-recorded Performix runs that keep the input stable, and a judge LLM that scores each generated insight against a private rubric. The remaining question is how to invoke Dynamic Insights during testing.
We use 2 invocation paths. The first uses a simple REST interface. The harness prepares the evidence payload, sends it to the LLM in a single request, captures the response, and passes it to the judge LLM for scoring. This provides a useful baseline. It validates the evidence format, prompt guidance, and rubric without introducing MCP tool calls or coding agent behavior.
The second path uses a coding agent that interacts with the Performix MCP server. When the agent receives a high-level prompt, such as "e.g. Show me insights for run XXX", it invokes tools on the Performix MCP server to retrieve the run summary and analysis guidance before generating the insight.. This is the path users would follow, so it is the one that matters most, however, it also has more moving parts.
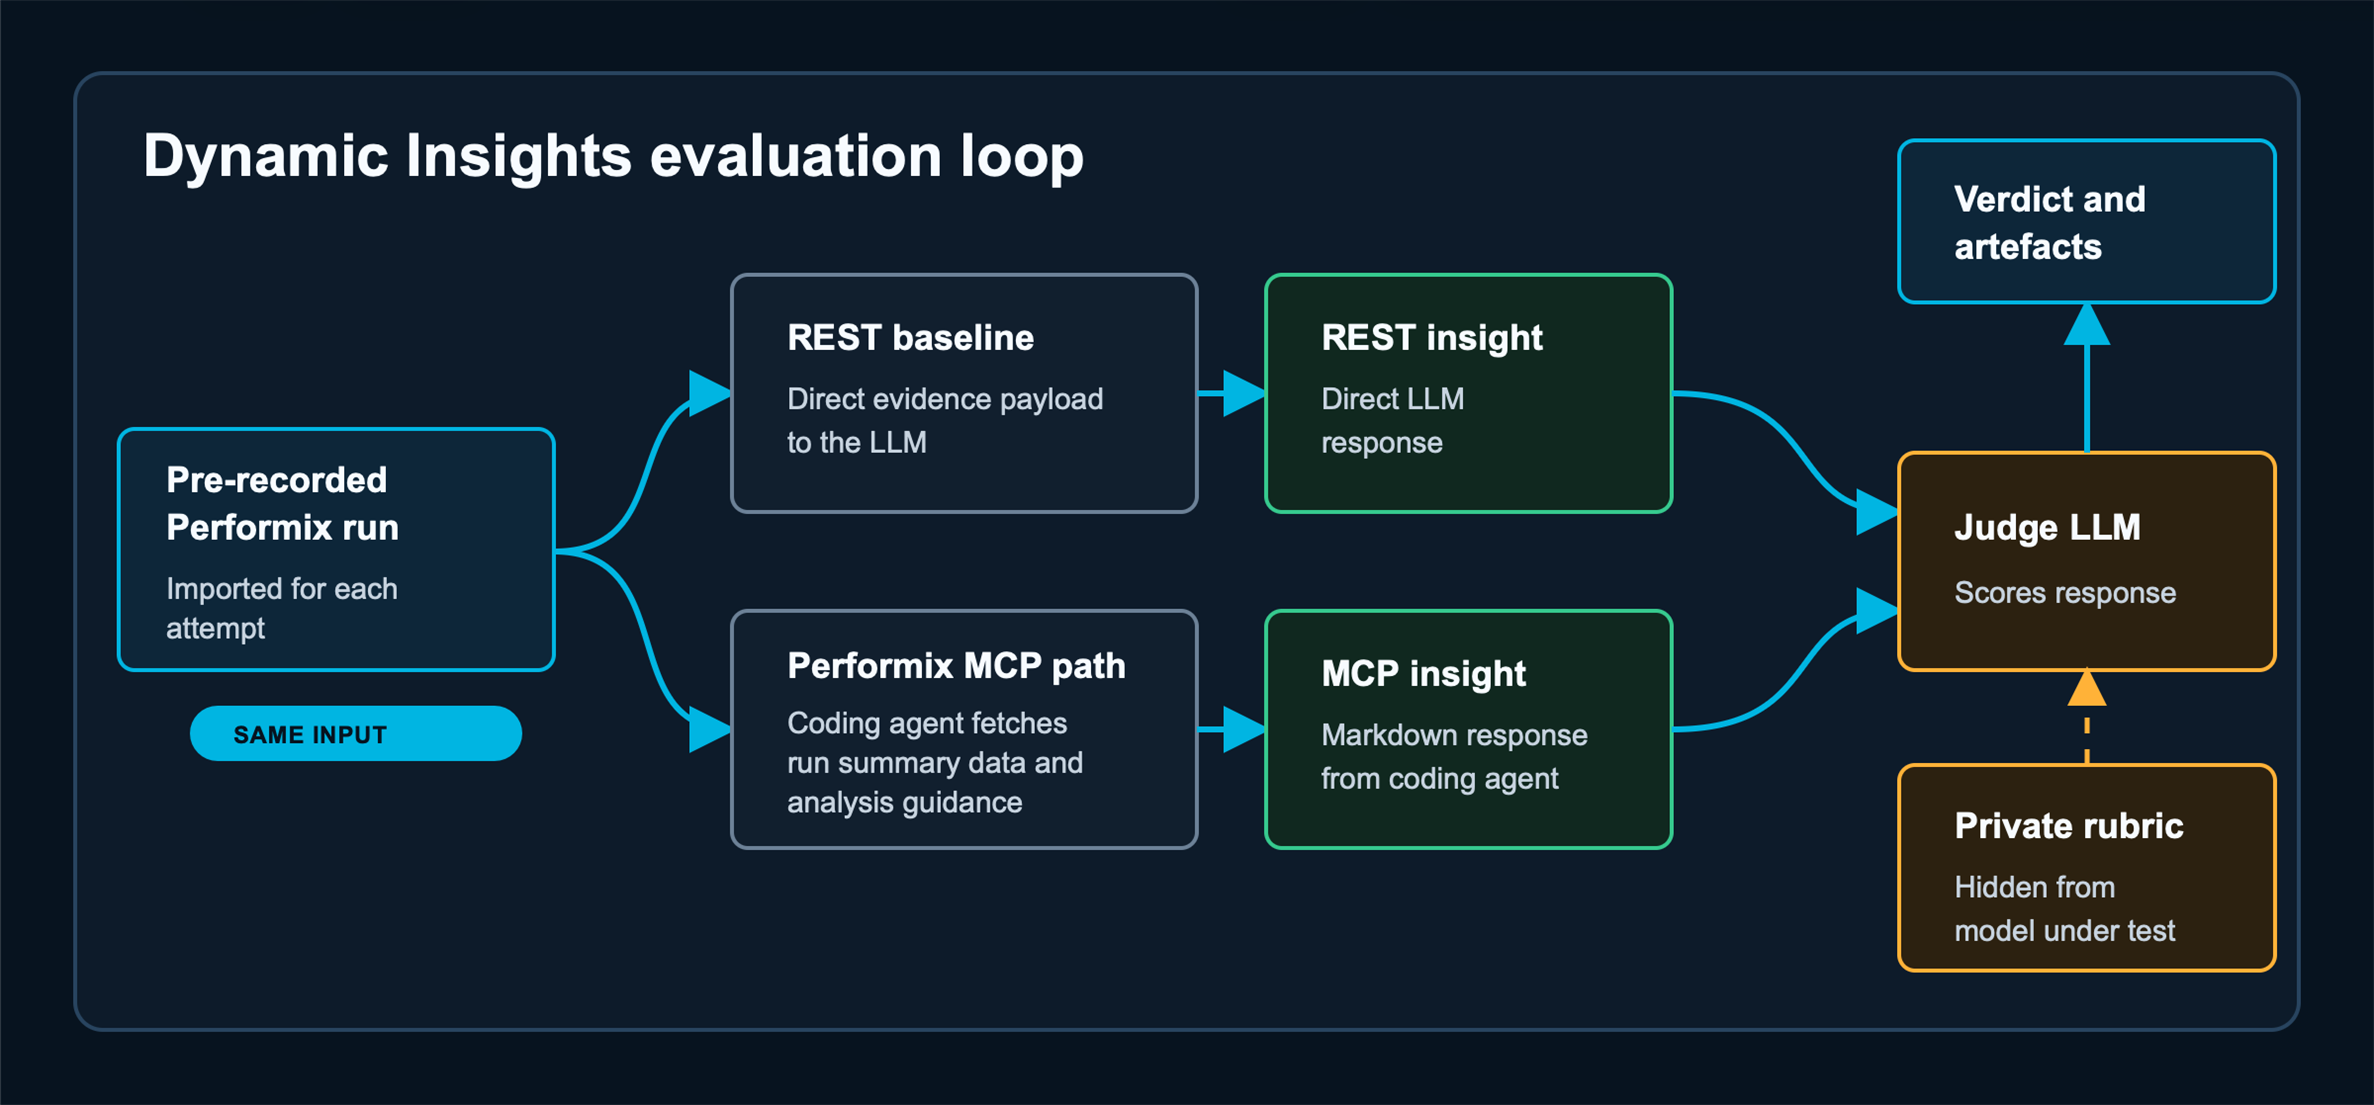
Running both paths against the same pre-recorded run provides a basis for comparison. The REST path verifies that the evidence payload, prompt guidance, model configuration, and rubric work as expected. The MCP path then verifies that the same analysis still works when routed through the interface used by coding agents.
This separation is useful because the MCP path includes more steps, such as multi-stage tool calls, and introduces additional failure modes. For example, coding agents can impose token-count limits on MCP tool output. If relevant profile evidence is truncated before it reaches the LLM, the generated insight can appear incorrect even though the underlying analysis might still work correctly when given the full evidence.
A concrete example: CRC32C
To illustrate the approach, we examine one of the early test cases. test_case_03 is a synthetic C++ workload that calculates a checksum over a large input buffer and reports the execution time. This type of operation is common in backend systems to store a checksum alongside data written to disk or sent over the network.
The test case models a common issue that we see when profiling workloads recently ported to AArch64. The code includes a baseline cross-platform C++ implementation and an optimized x86-64 path that uses x86-64 specific CRC32C instructions. The optimized path runs significantly faster than the generic implementation. The AArch64 build runs correctly, but it falls back to the scalar path and does not use the corresponding Arm CRC32 instructions. The following excerpt is a simplified version of the test case with comments added. The production version of the test case omits these comments to avoid giving the LLM additional hints. – It relies only on the source code and the Performix profile as inputs, just as it would in a real-world scenario.
// Generic baseline implementation for all architectures.
// Calculates CRC of the buffer one byte at a time.
uint32_t crc32c(const uint8_t* data, size_t size) {
    uint32_t crc = 0xFFFFFFFFu;
    for (size_t i = 0; i < size; ++i) {
        crc = crc32c_byte_unrolled(crc, data[i]);
    }
    return ~crc;
}

// Inner function for `crc32c` - calculates each bit of the input bytes' CRC.
inline uint32_t crc32c_byte_unrolled(uint32_t crc,
                                     uint8_t byte) {
    crc ^= static_cast<uint32_t>(byte);
    // Branchless, fully unrolled update for one byte.
    constexpr uint32_t kPolynomial = 0x82F63B78u;
    crc = (crc >> 1) ^ (kPolynomial & (0u - (crc & 1u)));
    crc = (crc >> 1) ^ (kPolynomial & (0u - (crc & 1u)));
    // ... Repeated for each bit in the byte...
    return crc;
}

// Optimised x86-64 implementation - uses the `crc32` instruction from
// SSE4.2 extension to calculate up to 8 Bytes of CRC32C at once.
#if defined(__x86_64__)
__attribute__((target("sse4.2")))
uint32_t crc32c(const uint8_t* data, size_t size) {
    uint64_t crc = 0xFFFFFFFFu;

    // Calculate 8 bytes at a time while possible.
    while (size >= 8) {
        uint64_t word;
        memcpy(&word, data, sizeof(word));
        crc = _mm_crc32_u64(crc, word);
        data += 8; size -= 8;
    }
    // Calculate 1 byte at a time for remaining data.
    uint32_t crc32 = static_cast<uint32_t>(crc);
    while (size-- != 0) {
        crc32 = _mm_crc32_u8(crc32, *data++);
    }
    return ~crc32;
}
#endif
When we profile this workload on an AArch64 machine and analyze it with Performix Dynamic Insights, we expect the LLM to identify that the generic crc32c implementation was executed. It should also identify that no optimized code path exists for Aarch64. The LLM should therefore recommend implementing an Arm-specific version that uses the Aarch64 CRC32 extension, similar to the existing x86-64 implementation.
We verify the result against a test-specific rubric. For test_case_03, the rubric defines the expected CRC32C analysis and the pass/fail criteria. The model under test never sees this rubric, it is provided only to the judge LLM.
**Problem Summary**

- Insight target: scalar CRC32C bitwise loop where Arm CRC32C
  instruction path should be suggested.

**What The LLM Should Suggest**

- Identify checksum loop as dominant hotspot.
- Suggest Arm CRC32C instruction-backed implementation or intrinsic/library
  path as a candidate action.
- Suggest validating correctness and measuring before/after speedup against
  the scalar baseline.

**Scoring Guidance**

- Pass:
  - Recognizes the checksum loop as a hotspot and suggests an Arm CRC32C
      instruction or library path as a candidate optimisation.

- Fail:
  - Identifies the hotspot but gives only generic tuning suggestions.
- Misses the checksum hotspot or suggests an unrelated primary fix.without requiring exact wording from the generated response.
What failures tell us
A failed attempt should provide enough information to debug the problem, not just report a CI failure. For each test run, the harness records the generated response, the judge result, MCP call metadata, token usage, the imported run provenance, and other test artifacts. This information helps us determine what changed. The difference might be the evidence passed to the model, the prompt guidance, the rubric, the coding agent interaction, or the model response itself.
The REST baseline is particularly useful during bring-up and stabilization. It provides a known comparison point when the product path fails.
Conclusion
Dynamic Insights is more than a prompt wrapped around profiler output. To produce useful performance advice, it must collect the right evidence from Performix, carry that evidence through the coding agent workflow, and generate recommendations that are specific to the measured workload and its environment.
That is why evaluating the generated insights was a fundamental part of developing the feature. Our test harness uses a representative workload corpus, pre-recorded Performix runs, private rubrics for each test case, a judge model, a direct REST baseline, and the same MCP path used by coding agents. This approach verifies that the LLM produces for the expected analysis for each test case and that the recommendations are valid, specific and actionable.
This does not guarantee that Dynamic Insights will analyze every workload perfectly. LLMs continue to make mistakes so we should treat their recommendations with appropriate skepticism. However, it does give us confidence in what we have delivered through a robust engineering process. We preserve the evidence, evaluate the insight semantically, capture the artifacts, inspect failures, improve the guidance, and add new workloads.
We believe this level of rigor is important for our users. A compelling MCP demonstration can show that a model can produce strong results for a single workload. A robust evaluation framework gives us greater confidence that Dynamic Insights provides useful guidance across a wide range of workloads.
If you have not tried Dynamic Insights yet, we encourage you to do so. Let us know what works well and, just as importantly, where it falls short. We can add those problem scenarios to our evaluation suite and continue improving Dynamic Insights!
Ready to try it for yourself? Follow the Learning Path to get started with Dynamic Insights in Visual Studio Code using Codex.

By Dave Rigby
Re-use is only permitted for informational and non-commercial or personal use only.
