What's new in Arm Performix
Explore the latest Arm Performix features, from AI-assisted profiling to system analysis, code insights, and streamlined performance investigations
Developers and coding agents need tools to ensure their workloads are highly optimized for the target environment. Arm Performix is a performance analysis toolkit that helps you achieve peak performance-per-watt for workloads running on Arm platforms.
Since Performix launched in April, we have published a new build every 2 weeks adding capabilities designed to make performance investigations easier to start, interpret and act on. These updates also establish a stronger foundation for developers who want to connect AI agents to Performix and use profiling data as part of a repeatable performance-engineering workflow.
These updates include:
- Dynamic Insights through integration with coding agents
- System Utilization analysis
- Instruction-level code disassembly
- Improved organization and simpler comparisons of performance runs
- System Call Tracing
- Open Sourcing of core repositories
This blog post examines these capabilities and how, together, they help developers investigate, understand, and improve application performance of workloads running on Arm.
Supporting iterative performance investigations
Real-world performance investigations rarely follow a straightforward path. Developers often test multiple hypotheses, compare experiments, and refine an application repeatedly before identifying the changes that produce the required result.
We shape the Performix roadmap around this iterative workflow. The goal is to reduce the manual effort of collecting and interpreting performance data, while helping developers move from a system-level symptom to the relevant workload, source code, or instruction more quickly.
Dynamic Insights
Performance engineering requires detailed analysis and expert insight to determine what to investigate or optimize next. Dynamic Insights combines detailed profiling data from Performix with the reasoning capabilities of a large language model (LLM). This enables automatic hotspot detection, suggested code improvements, and prioritized optimization recommendations. The workflow supports different models and coding assistants, including Claude, Codex, Gemini, and GitHub Copilot.
Performix includes a built-in MCP server that gives your preferred AI agent access to Performix data, including profiling samples, source code, instruction disassembly and target platform capabilities. We balance token usage with the level of detail needed for useful agentic interpretation.
Learn more about how Dynamic Insights works and how we evaluate the accuracy and usefulness of its recommendations. We will continue to expand these capabilities in future releases.
System Utilization recipe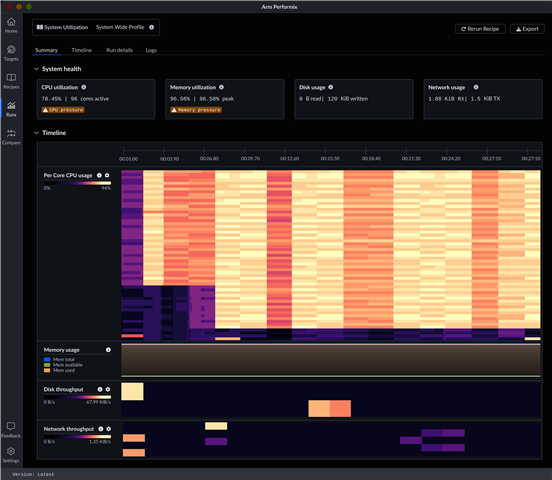
Many performance investigations start by understanding overall system activity. Developers need to know which CPU, memory, disk, and network resources are available, whether any are saturated, and how resource use changes over time.
The System Utilization recipe brings these signals together in a single view. It helps developers identify likely bottlenecks before they spend time optimizing code that might not be responsible for the observed behavior.
Organize your Runs
We have added folder organization to the Runs view so developers can group related experiments in one place. This helps when testing several potential optimizations, build configurations, compiler settings, or workload variants.
Organizing Runs by investigation makes it easier to move between results, preserve the context for each experiment, and compare how individual changes affect performance.
Simplified comparison
Performance tools can capture large volumes of data but showing every metric can make meaningful differences harder to identify. We have simplified the default views in the Performix Comparison feature so developers can identify the most significant differences between runs more easily.
The underlying data remains available for deeper analysis, but the initial view prioritizes the signals most likely to explain a performance change.
Code disassembly
We have extended Code Hotspots and related recipes to show sample attribution at the instruction level. Alongside the source code, you can also see which instructions were executed. This level of detail is particularly useful for developers performing microarchitecture-aware optimization or examining compiler-generated assembly on Arm-based systems.
Starting with the System Utilization analysis, an investigation can progress from “the CPUs are busy” to “these source lines account for the activity” and finally to “these instructions dominate execution.”
System Call Tracing recipe
Traditional performance investigations often require developers to work across several tools, dependencies, command-line options, and output formats. Performix consolidates these sources of information into a more consistent investigation workflow.
The Linux strace utility is one example. When an application spends a lot of time in kernel space, developers need to understand which system calls it makes, how frequently it makes them, and how long they take.
The new System Call Tracing recipe captures this information alongside other Performix data. Developers can review system call behavior in the context of CPU utilization, code hotspots and related profiling results instead of analyzing it in isolation.
Open sourcing
Open source supports collaboration, transparency, and shared learning across the developer community. By making our work available, we enable others to learn from our approach and apply relevant techniques to their own tools and workflows. We have started by publishing core repositories for Performix, Arm System Characterization Tool (ASCT), and Arm SoC Telemetry Library (ASTL). This is the first step in an ongoing effort. We will publish more repositories, improve our feedback and contribution guidance, and maintain these repositories over time.
What comes next for Performix
The capabilities introduced over the past few months establish a foundation for more connected, AI-assisted performance investigations. Performix already brings system data, profiling results, and model-assisted analysis into a single workflow, but we will continue to expand its capabilities.
Over the next few quarters, we plan to support more platforms, expand LLM integrations, provide deeper analysis for machine learning workloads, and introduce power telemetry where platform support enables it. Developer feedback will continue to guide how we prioritize and refine these capabilities.
Download and use Performix for free
Explore the latest release, try it with your own workloads, and share your feedback with the Performix engineering team.

Re-use is only permitted for informational and non-commercial or personal use only.
