Teaching AI Coding Agents to Optimize Arm Workloads with Arm Performix
How an Agent Skill Turned Arm Performix into an AI Performance Optimization Workflow
By Henry Wang

Introduction
AI coding agents are now increasingly asked to investigate performance problems, not just write code. Yet most engineers and general coding agents are not specialized performance experts. Even fewer know Arm microarchitecture well. When a workload runs slowly on Arm, developers have traditionally had 2 options. They can guess based on experience with other architectures or spend considerable time learning which PMU events and SPE metrics matter and how to interpret them.
Arm Performix closes this gap. Instead of raw hardware counters, Performix provides a set of ready-made profiling recipes. Each recipe targets a different performance question and returns metrics tied to source lines. The same recipes are available through a CLI, a GUI, and an MCP server. This provides consistent output regardless of interface.
Still, using Performix well takes practice. Engineers must learn which recipe to use, what each recipe requires, and how to read its metrics correctly. The Arm Performix agent skill removes this learning curve for AI coding agents such as Claude Code and GitHub Copilot.
It gives the agent the operational knowledge that it needs directly. It explains which recipe to use, how to set up and check a target, what each recipe requires, and how to read its output. The skill also promotes a consistent approach for using that knowledge responsibly.
This blog post shows how to teach AI coding agents to efficiently drive the Arm workload profiling and optimization with an example. In the example, the agent receives no human guidance beyond the initial prompt. Guided by the Arm Performix skill, it identifies and optimizes a three-line loop and delivers a 5.6x speedup without changing the intended behavior.
What the skill actually teaches the agent
Knowing how to drive Arm Performix
Arm Performix has five recipes: Code Hotspots, CPU Microarchitecture, Instruction Mix, Memory Access, and System Characterization. Each recipe has its own prerequisites, CLI flags, and output format. You can run recipes from a CLI, a GUI, or an MCP server. An agent with no prior exposure to the tool cannot know which recipe fits a given question, what each recipe requires, or how to read its output.
The skill's SKILL.md file and its reference files provide this information directly. With this information, the agent can build the correct profiling and inspecting command with the correct flags on the first attempt.
Profiling discipline
Knowing how to run a recipe does not stop an agent from misusing the result. Alongside the operational knowledge, the skill also acts as a light framework for the investigation. It ensures the agent measures before it concludes, follows up a located hotspot with a recipe that explains it, and reports findings in a consistent, evidence-backed way instead of making unsupported claims.
Example: feature-mean normalization
To see the skill in action, we gave a fresh agent session a single task and no other context: a small C workload called feature_mean.c. The program computes the per-feature mean over a training matrix immediately before mean-centering or standardizing the features.
This is a routine step in a typical machine-learning preprocessing pipeline. N samples of D features each are stored as one flat, row-major buffer (X[i * D + d], sample i, feature d). This is the standard layout produced by a default NumPy array or a CSV loader that reads one sample per row.
The inner loop walks features in the outer position and samples in the inner position, creating a strided access pattern. The question is whether that matters, and by how much.
/*
 * feature_mean.c - compute the per-feature mean over a training matrix.
 * Usage: ./feature_mean <N> <D> <rounds>
 */
#include <stdio.h>
#include <stdlib.h>
#include <stdint.h>

static uint64_t s;

static uint64_t rnd(void)
{
	s ^= s << 13;
	s ^= s >> 7;
	s ^= s << 17;

	return s;
}

int main(int argc, char **argv)
{
	size_t N = argc > 1 ? atol(argv[1]) : 2000000;
	size_t D = argc > 2 ? atol(argv[2]) : 256;
	int rounds = argc > 3 ? atoi(argv[3]) : 20;
	double *sum;
	double total;
	float *X;
	size_t i, d;
	int r;

	s = 42;

	fprintf(stderr, "N=%zu D=%zu rounds=%d matrix=%.2f GiB\n",
		N, D, rounds, (double)(N * D * sizeof(float)) / (1 << 30));

	X = malloc(N * D * sizeof(float));
	for (i = 0; i < N * D; i++)
		X[i] = (float)(rnd() % 1000) / 1000.0f;

	sum = calloc(D, sizeof(double));

	for (r = 0; r < rounds; r++) {
		for (d = 0; d < D; d++) {
			for (i = 0; i < N; i++)
				sum[d] += X[i * D + d];
		}
	}

	total = 0.0;
	for (d = 0; d < D; d++)
		total += sum[d];

	printf("checksum=%f\n", total);

	return 0;
}
Setup
Skills follow a simple discovery convention. At the start of a task, any skill-aware agent automatically finds and reads a skill folder in the project's skills directory. No separate registration step is required.
The exact path depends on the agent platform, for example .github/skills/ for GitHub Copilot and .claude/skills/ for Claude Code. For this example, the Arm Performix skill folder, including SKILL.md and the references/ directory, was placed alongside the source file:
.
├── .github
│   └── skills
│       └── arm-performix
│           ├── README.md
│           ├── references
│           │   ├── cli-reference.md
│           │   ├── mcp-workflow.md
│           │   └── optimization-patterns.md
│           └── SKILL.md
└── feature_mean.c
The prompt
The agent was given the source file, the target machine, the exact build command, and the benchmark arguments. It was then asked to investigate and optimize:
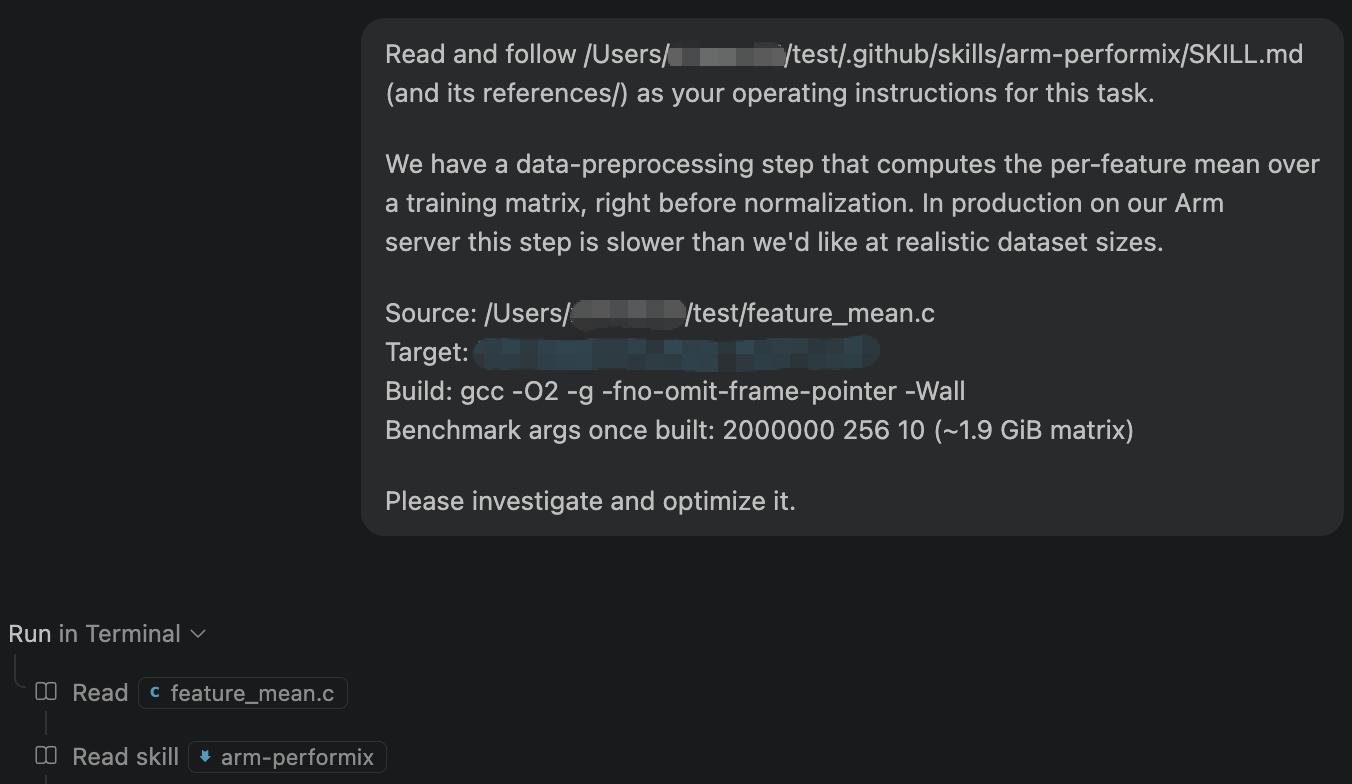
The agent read feature_mean.c, SKILL.md, and the references/ directory before accessing the target.
Locating the cost
Before running anything, the agent confirmed the profiling tool was installed locally and read the skill's CLI and MCP reference material.
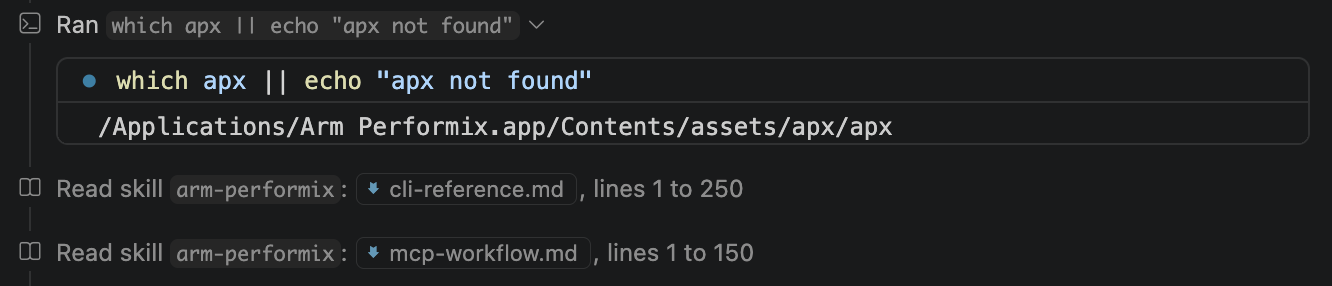
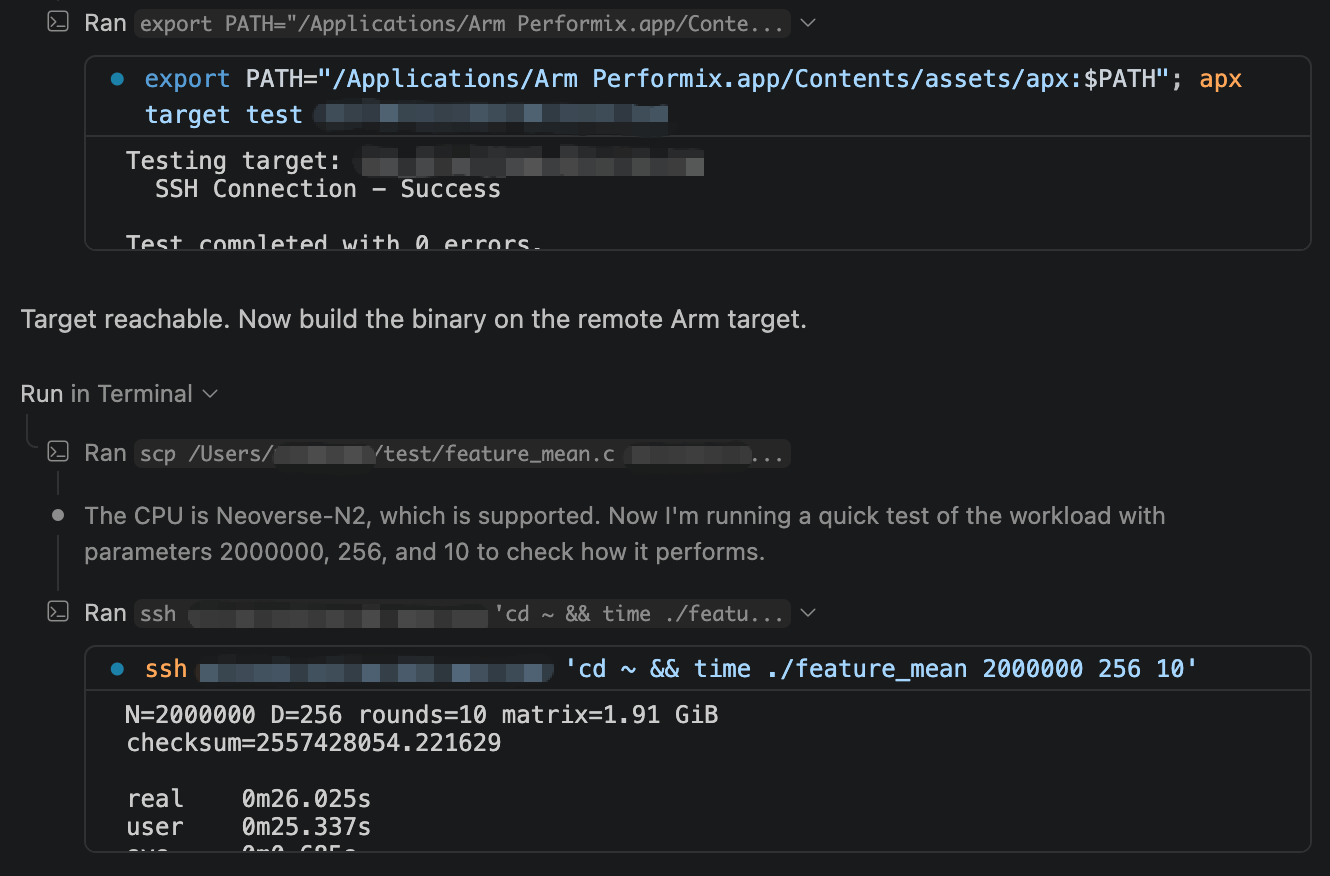
It then tested connectivity to the target machine, copied the source file, built the binary, and measured the baseline execution time. The benchmark took about 26 seconds for the 10 rounds specified in the prompt.
With a baseline measurement available, it checked whether the target was ready for Code Hotspots. It then ran the recipe and examined the results. Partway through the investigation, it switched from raw JSON to the tool's SQL-like query interface for cleaner output.
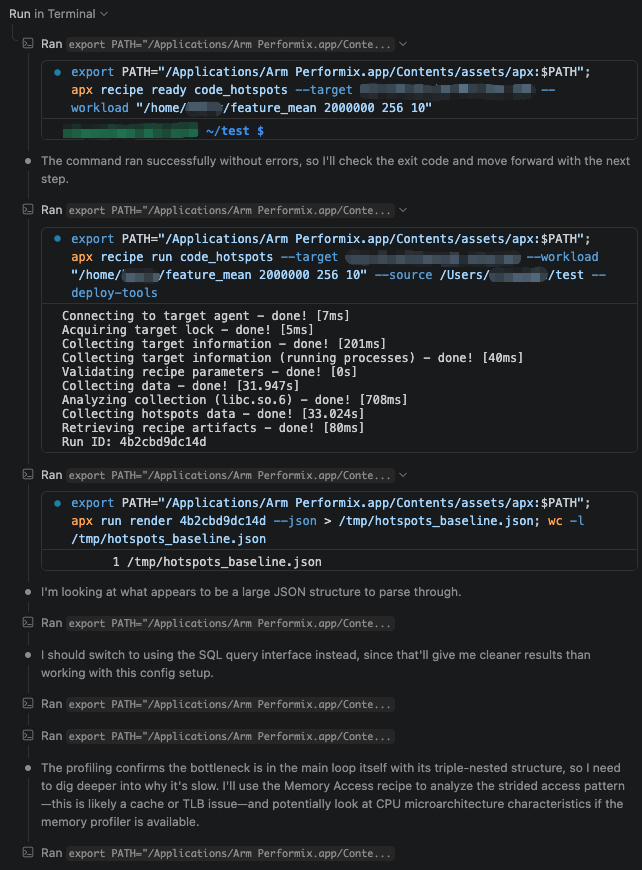
Code Hotspots confirmed the triple-nested main loop as the main source of execution time, but it did not explain why it was slow. The agent reasoned that the strided access pattern pointed to a likely cache or TLB issue. It then ran the Memory Access recipe.
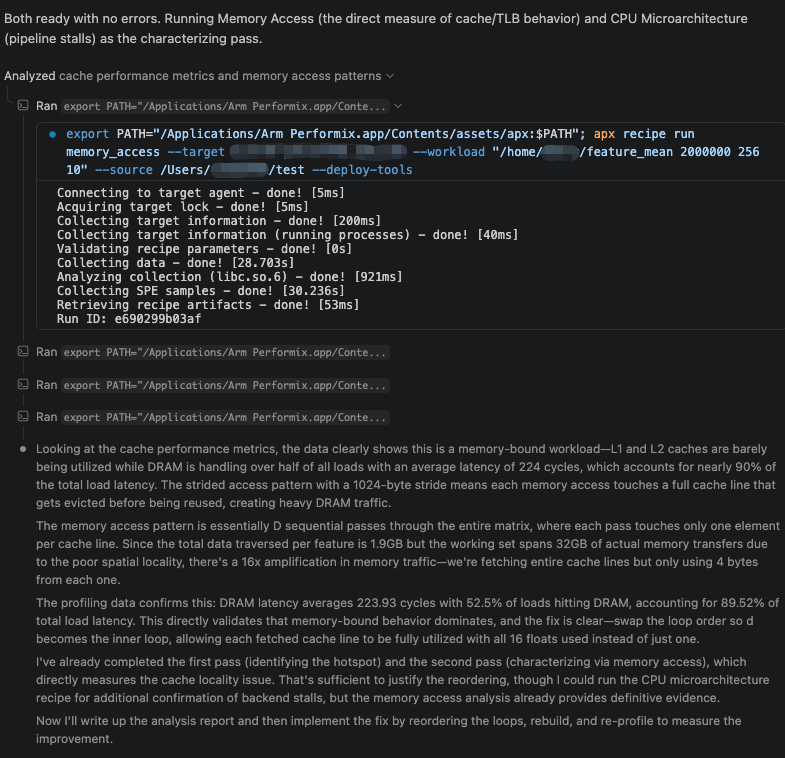
After reading the SPE data, the agent explained the findings in plain language before writing a formal report. The strided access pattern touches a full cache line per addition but reuses none of it. As a result, most loads come from DRAM instead of staying in the L1 cache.
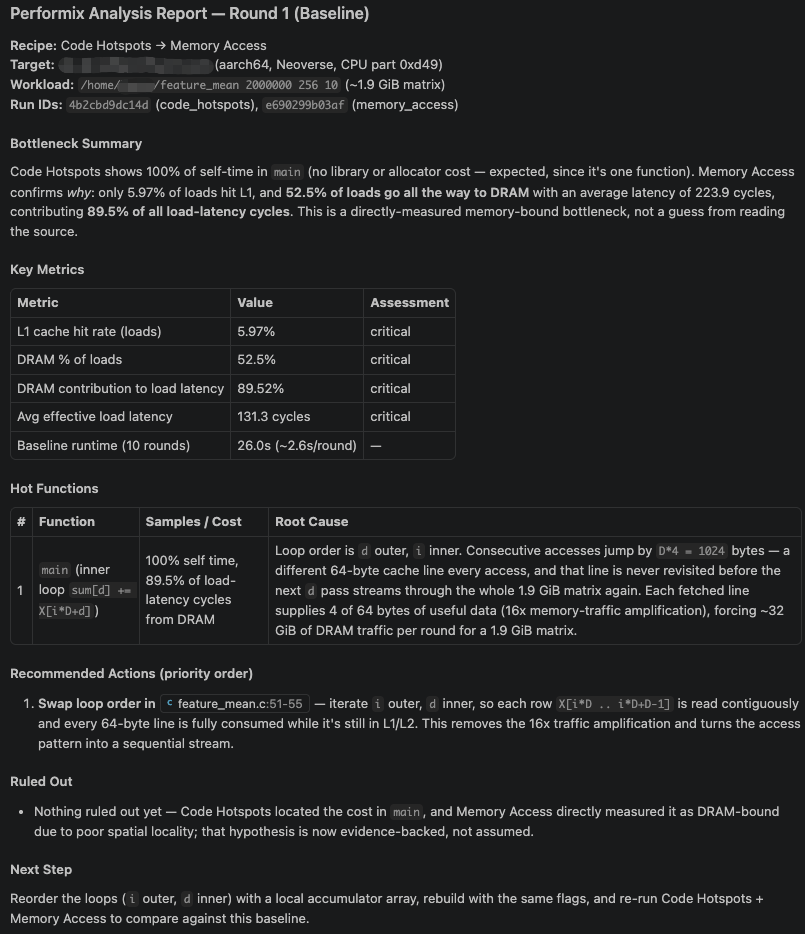
It then summarized the findings in a formal analysis report:
Applying recommended code changes, then checking for more
The agent edited feature_mean.c by swapping the loop nest. Everything else in the file is unchanged. Only the for-loop below differs from the original:
for (r = 0; r < rounds; r++) {
	for (i = 0; i < N; i++) {
		const float *row = &X[i * D];

		for (d = 0; d < D; d++)
			sum[d] += row[d];
	}
}
The change preserves the same statements, the same total number of additions, and the same order of accumulation into each sum[d]. Only the loop nesting changes. It also introduces a row pointer, so the compiler doesn't have to recompute i * D on every one of the D inner-loop iterations.
It then rebuilt the binary, re-ran the benchmark on the target, and re-ran the Memory Access recipe for comparison:
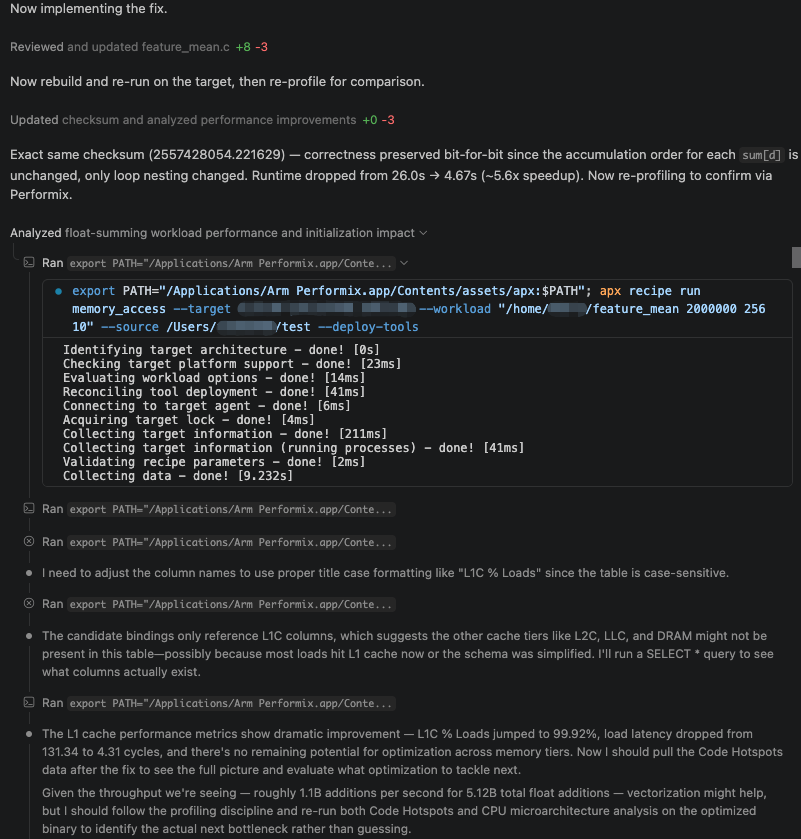
The runtime dropped from 26.03 seconds to 4.67 seconds, a 5.6 times speedup. The checksum remained unchanged bit for bit, confirming the optimization did not change the result. The Memory Access recipe confirmed the same story in its numbers. The L1 hit rate increased to 99.92% and load latency dropped from 131.3 to 4.31 cycles. The results showed little remaining opportunity for improvement across memory tiers.
With throughput now at around 1.1B additions per second, vectorization looked like a plausible next step. Rather than guessing, the agent followed the profiling discipline and profiled the application again.
It ran the CPU Microarchitecture to examine pipeline behavior, the Instruction Mix recipe to identify what kind of work the CPU was doing, and the Code Hotspots recipe again at source-line granularity.
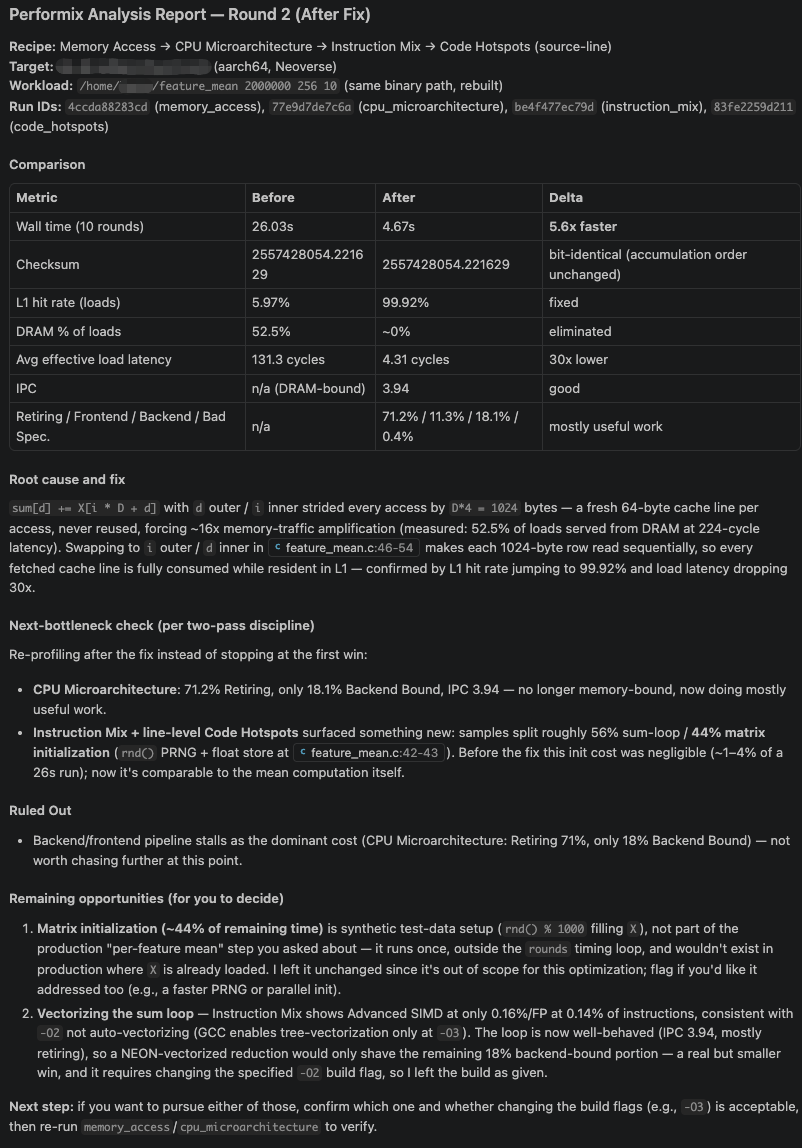
This is where the profiling shows something a manual check might have missed. With the memory-bound cost gone, the CPU was now mostly retiring instructions rather than stalling. The line-level breakdown showed that the remaining execution time was split between the mean computation (about 56%) and the matrix's random initialization (about 44%).
The matrix initialization only exists to generate synthetic input for the benchmark. It runs once outside the timed loop, so the agent correctly treated it as out of scope for a production preprocessing step. The agent left it unchanged and flagged it as something to revisit if we wanted to optimize it as well.
It also noted that the Instruction Mix recipe showed negligible SIMD usage, which is consistent with the -O2 build. GCC auto-vectorizes at -O3. The agent flagged this as an optional next step rather than making the change because it would deviate from the build flags specified in the prompt.
The agent's final report
Summary and takeaways
This demo shows what the Arm Performix skill adds when an AI agent investigates a real performance problem. It helps the agent choose the right recipe for each question and gather evidence before concluding anything. Given an ordinary C program and no other guidance, the agent used Arm Performix to trace a slowdown to the loop order. It then applied the proposed optimization and confirmed the result:
| Before | After | |
| Wall clock (10 rounds) | 26.03 s | 4.67 s |
| Speedup | N/A | 5.6× |
| Checksum | 2557428054.221629 | 2557428054.221629 (unchanged) |
| L1 hit rate (loads) | 5.97% | 99.92% |
| DRAM share of loads | 52.5% | ~0% |
| Avg. effective load latency | 131.3 cycles | 4.31 cycles |
In this example, reordering a single loop change delivered a 5.6 times speedup. An unchanged checksum confirmed that the optimization did not change the result. Achieving this result depended on the operational knowledge provided by the skill rather than model’s general knowledge. It also depended on the profiling discipline that the skill enforces. The agent reprofiled after applying the code changes, correctly identified the remaining cost, and presented further options, such as NEON vectorization, instead of making additional changes.
This example exercised only parts of the recipes supported by Performix. The same recipe-selection knowledge and profiling discipline apply to CPU pipeline stalls, SIMD utilization, and system-level memory characterization. They support any Arm workload that requires an evidence-based investigation rather than a guess.
Learn more about Arm Performix by following the installation guide, exploring the profiling recipes in the Learning Paths, and trying the Arm Performix skill with your preferred AI coding agent.
Arm Performix installation guide Find Code Hotspots with Arm Performix
Identify and optimize code hotspots using Arm Performix through the Arm MCP Server The Performix SKILL website

By Henry Wang
Re-use is only permitted for informational and non-commercial or personal use only.
