
Build Native, High-Performance Apps on Arm
Create fast, efficient, and AI-powered apps that run natively on Arm PCs. Start developing with optimized tools, SDKs, and AI-ready performance features.
Software Development Tools
- Build
- Optimize
Windows on Arm Tutorials and Resources
For detailed guides and documentation on how to develop, optimize, and debug for Arm64, explore the resources below.

Learning Paths
Learning paths are created by Arm and the Arm software developer community to solve problems developers face while developing on and for Arm.
What is Windows on Arm?
Windows on Arm (WoA) is a version of the Microsoft Windows operating system designed to run efficiently on Arm-based processors, and fine-tuned for the Arm architecture. The next generation of laptops are being built on the Arm architecture and the hardware and software tools are ready for you to build Windows on Arm apps. Due to its high performance and power efficiency, the ecosystem is already building native on Arm64.
Explore the resources and tutorials you need to start your development, discover who in the application ecosystem is native to Arm, and learn how you can join our developer community for specialist support from Arm Ambassadors and experts.
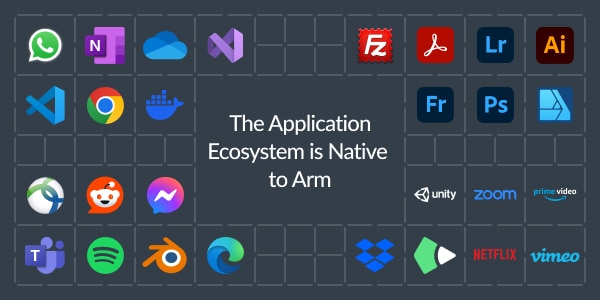
The application ecosystem is native to Arm, and the software development ecosystem is proven for robust and comprehensive native app development. Office 365, Spotify, Zoom, Slack, Adobe, and more have ported their applications to run for Arm64 as Arm-native Windows apps. As a result, they’ve gained power efficiency and improved user experiences.
Join the Arm Developer Program
Share ideas, get expert support, and level up your projects with tools, resources, and direct access to Arm’s global developer community.
Arm Experts
Arm’s own subject-matter experts are here to help, providing development guidance and support for developers building on Arm.