Introducing Frame Advisor with Arm Mobile Studio 2023.5
Learn about Frame Advisor, a new frame-based performance analysis tool to help you optimize rendering workloads for Arm Immortalis and Mali GPUs.
By Julie Gaskin

Arm Mobile Studio 2023.5 introduces the first release of Frame Advisor, a new frame-based performance analysis tool to help you optimize rendering workloads for Arm Immortalis and Mali GPUs. The goal of Frame Advisor is to provide performance feedback and best practice recommendations, with results automatically correlated to specific API-visible workloads submitted by your application. This makes application optimization easier, with less need to interpret raw data from the hardware.
The Frame Advisor 1.0 release is an early access release, supporting a limited feature set that focuses on efficient use of render passes and efficient encoding of asset geometry. These are 2 areas of application API use that are critical to rendering efficiency on Arm GPUs. We are planning to add more analysis features, covering aspects of the API such as draw state and shader feedback. We welcome your feedback on what you would like to see in future releases.
Note: As the first release of a new tool, this release does have a few bugs and known issues. Refer to the Arm Mobile Studio Release Note for details.
Why Frame Advisor
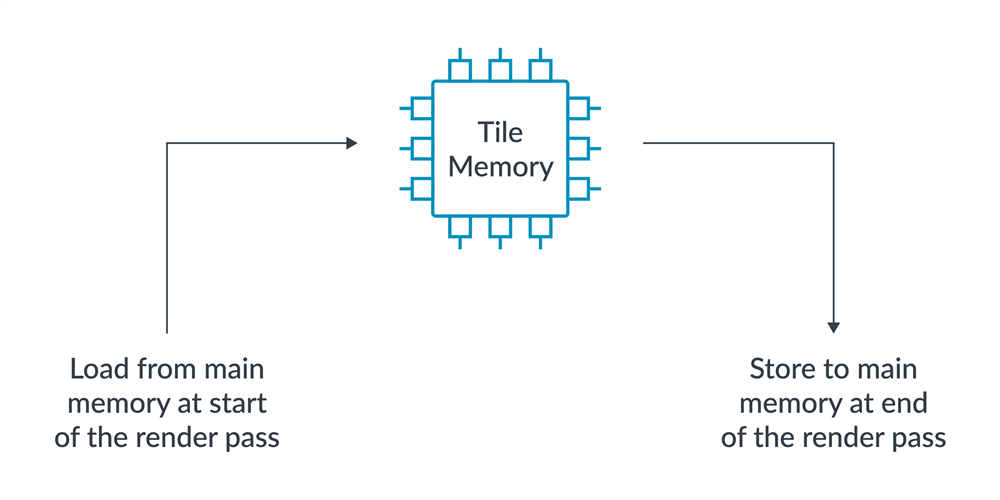
Arm GPUs use tile-based rendering to process render passes. This means that geometry for each render pass is processed first, with primitives assigned to the small screen-space tiles that they cover. Once geometry processing is complete, these small tiles are fragment shaded to completion before being written out to memory.
The advantage of this scheme is that these tiles are small enough to be stored in a local RAM inside the GPU. This keeps the working set of fragment shading on-chip, instead of using power-hungry external DRAM bandwidth. However, this style of processing makes profiling harder.
When using tile-based rendering, the processing workload for each draw call is broken up into small pieces and interleaved with other draw calls. In addition, render passes are often pipelined and overlapped with other render passes running in parallel. This makes it difficult to extract clear advice when relying on hardware-only data sources, such as the time-based profiles you can capture with Arm Streamline. You can use hardware counters to see that a problem is occurring, but it is not always clear where the problem originates from in the application. Bridging this gap, providing API-correlated advice, is where Frame Advisor comes in.
What insights can Frame Advisor provide?
Frame Advisor is a deep-dive profiler that can help you understand why a specific frame is running slowly. It is intended to be used after you have identified a slow frame region using another tool, such as our Streamline profiler or an in-engine profiler.
Frame Advisor lets you capture a few frames of gameplay and focus in on that problem area. Frame Advisor captures all the API calls and data that crosses the API boundary for those frames, as well as the GPU output for those frames. This allows the tool analysis to really understand the workload and how the GPU is going to process it. This process is invasive to your application performance during capture, but still only takes a few seconds to capture and analyze the data you need.
Render graphs
Render passes form the backbone of a graphics frame, and efficient use of render passes ensures that you get the most benefit out of the energy efficient on-chip tile memory inside of the GPU. If render passes don't make the best use of tile-based rendering, you are missing out on memory bandwidth savings that could prevent performance slow-downs.
So how can we tell if render passes are being processed efficiently? When you capture a frame with Frame Advisor, you get a visualization of the rendering for that frame, which can help you to spot problems.
Render graphs show an overview of the rendering operations that are performed to create the final rendered frame. You can see the data flow between render passes in the frame, and how resources such as textures are produced and consumed. This helps you to explore how efficiently data flows between render passes and find opportunities to optimize.
Each render pass in the render graph is shown as a box, with input and output sockets for each attachment. At the start of a render pass, input attachments are read into tile memory from DRAM. At the end of the render pass, output attachments are written back to DRAM. These memory accesses are costly, and should be minimized. So how can we do this?
- The first command in a render pass, before any draw calls are made, should clear or invalidate any input attachments, unless you are deliberately using that attachment as a starting point for that render pass. This avoids unnecessary readbacks from DRAM at the start of each pass. Similarly, each output attachment must be invalidated to avoid a store to memory.
- Additionally, you might see render passes where the output attachments of one pass are read as an input attachment of a later pass without any intervening use as a texture. These render passes could be merged into one, to avoid unnecessary reads and writes to DRAM.
- If you see render passes that have no consumers at all, they are not contributing to the final rendered output and can therefore be removed, saving processing power and bandwidth.
Quite often, making these adjustments to how your render passes are built can significantly improve performance, without making any changes to the objects on screen. However, Frame Advisor also provides you with great opportunities to save processing power, by taking a closer look at what is being rendered to the screen, and how efficiently that happens.
Discover redundant draw calls
Draw calls are expensive for the CPU to process, so it is important to use them efficiently and reduce the number of redundant calls. In Frame Advisor, you can see all the draw calls within a render pass, and step through them one-by-one to check if they render visible changes to the framebuffer.
This makes it easy to spot inefficient rendering, such as draws that are outside of frustum or are occluded behind other objects and could therefore be optimized out by the application software. There are a range of software culling techniques you can use to prevent this happening. It’s also easy to see where many identical objects are each being drawn individually and could therefore be batched into a single draw. These are easy wins to reduce computation, both on the CPU and GPU.
By stepping through the draw calls and observing the change to the frame buffer output, you can easily see whether opaque geometry is being rendered efficiently. Opaque objects should be rendered in a front-to-back order, starting with objects closest to camera and then working further away. If objects are rendered front-to-back, the GPU can use Early ZS testing to recognize and discard triangles that will be hidden behind other objects. This eliminates unnecessary work before fragment shading.
Check if geometry is being drawn efficiently
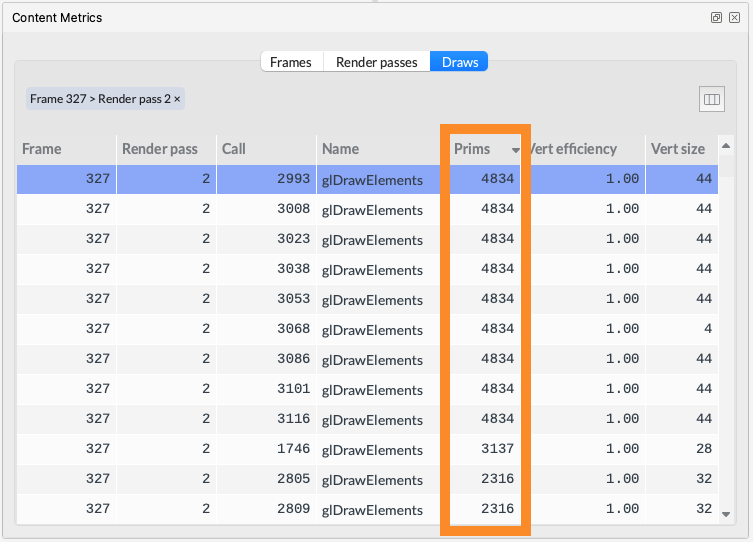
Often, a complicated character mesh wastes bandwidth and processing power when that character is far away in the distance on screen. The triangles within the mesh become so small that they begin to cause major performance problems, often with very little visible return. Frame Advisor shows you the number of primitives that were drawn with each draw call. Also, you can sort all the objects in a render pass by the number of primitives. So, it is easy to find the most complex objects in the scene and investigate whether they can be simplified.
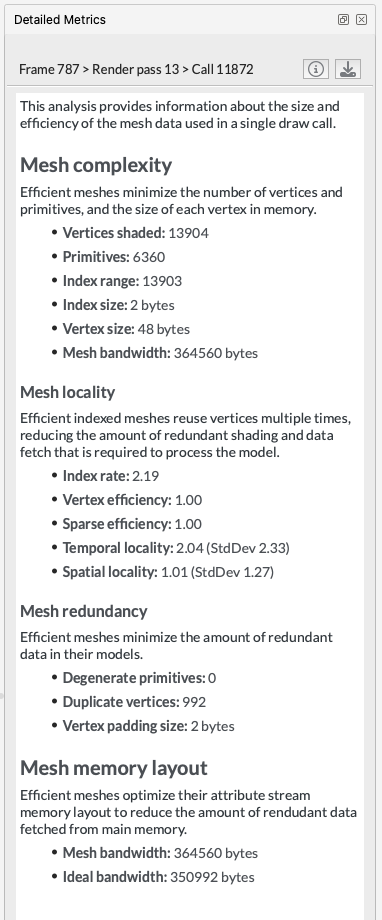
In cases where a model can not be simplified, it’s important to ensure they are being drawn efficiently. The detailed metrics view in Frame Advisor lists a range of useful metrics about the currently selected draw call, such as:
- A Vertex efficiency rating indicates whether unused vertices are being shaded, which could be due to overshading, or because the object mesh has poor locality, resulting in vertices being processed multiple times.
- The Index rate shows how many unique vertices are used per triangle in the mesh. Ideally this number should be close to 1, indicating that each vertex is efficiently reused by 3 triangles. The worst case is 3, indicating that every triangle is using three unique vertices.
- The number of Duplicate vertices, which have identical data to another vertex in the model, and are therefore wasting processing power.
Show me what Frame Advisor can do
Watch this video to see Frame Advisor in action. You'll learn how to:
- Capture a frame from a mobile game running on a connected Android device
- Use the Render Graph to identify redundant render passes
- Evaluate how a scene is built by stepping through the draw calls
- Find the most complex meshes in the scene and get detailed metrics about why they are complex.
- Find the least efficient meshes in the scene and discover metrics to help optimize them.
What’s coming next?
So this first release of Frame Advisor is just the start – we plan to add more features and capabilities to the tool over the next few releases. Keep an eye on our graphics, gaming and VR blogs to hear about the changes.
How can I try Frame Advisor?
Frame Advisor is free to use as part of the Arm Mobile Studio suite of profiling tools for Android. You can download it today from the Arm Developer website. Work through the get started tutorial or watch this video tutorial to learn how to capture frames and view the results.
Refer to the Frame Advisor user guide to learn how to use all the available features.
Help us refine Frame Advisor
Frame Advisor is still under development, and we’d like to hear your thoughts, comments and ideas about how we can improve it. How was your experience capturing and analyzing frames? Are there missing features you’d like to see? Tell us using the feedback form or email us at mobilestudio@arm.com.

By Julie Gaskin
Re-use is only permitted for informational and non-commercial or personal use only.
