What is Arm Performance Studio?
Arm Performance Studio gives developers free tools to analyze performance, debug graphics, and optimize apps on Arm platforms.
By Jai Schrem

Arm Performance Studio is a free suite of software tools. It helps you identify optimization opportunities in performance-sensitive end-user applications running on Arm-based hardware. Examples include:
- Games targeting Android mobile. Most modern smartphones run on Arm-based CPUs, and many also have Arm Mali or Immortalis GPUs
- Graphical applications running on Linux systems with Arm-based hardware, such as automotive infotainment screens.
These tools are provided by Arm at no cost. We want to help you make your applications run efficiently on Arm-based hardware.
Install Arm Performance Studio to get started. It is free to download and use!
Introducing the Hub
Arm Performance Studio 2025.4 now includes a centralized Hub that lets you launch the individual tools. You can still launch the individual tools directly, but if you are new to Performance Studio, the Hub is a great place to start. It helps you easily choose the right tool for your project. Future updates to the Hub will include links to user guides and tutorial content to help you get the most out of Performance Studio.
Watch our introductory video about the Hub here:
Getting started – which tool?
Which tool do you need to use? Let us look at a range of example projects and where you might get started with Arm Performance Studio.
Frame Advisor
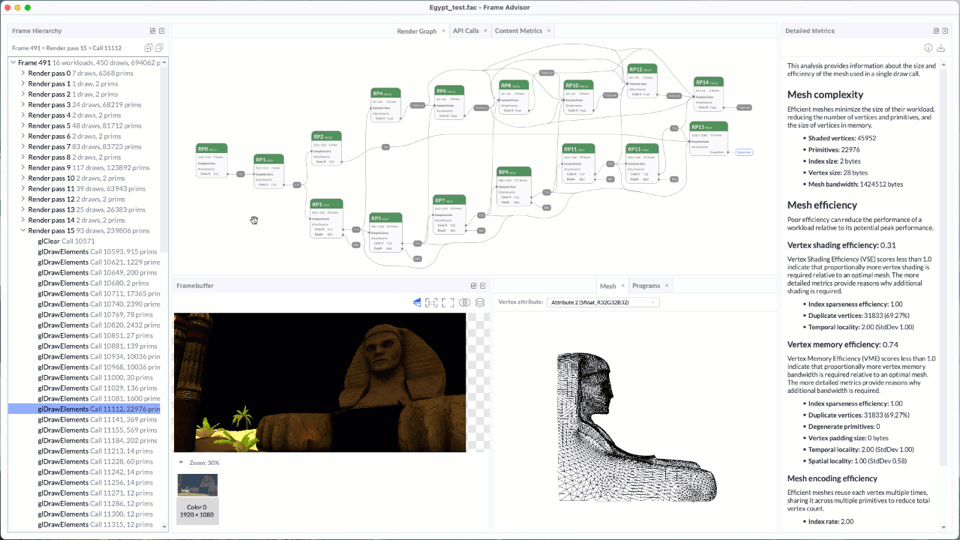
If you are developing a graphics-intensive Android application using OpenGL ES 2.0-3.2 or Vulkan up to version 1.2, Frame Advisor helps you quickly understand your rendering workloads. To get started, connect an Android device with an Arm GPU using adb (Android debug bridge). Then capture a short frame burst of a problematic scene.
Frame Advisor analyzes the graphics API calls made to the GPU, frame-by-frame. It shows you how the render pass, fixed-function transfer and compute shader workloads work together in a render graph visualization. You also get metrics about scene geometry, and color or depth framebuffer visualizations. Unlike RenderDoc, Frame Advisor lets you view the analysis without keeping the device connected.
Streamline
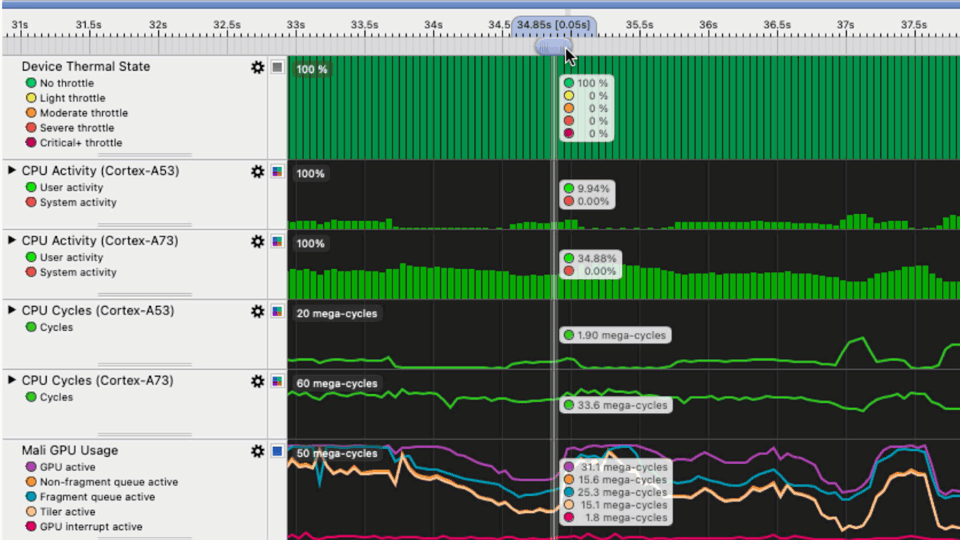
If you need detailed software program counter samples or hardware performance counters for Arm CPUs or GPUs, Streamline is the best tool for you. Streamline shows how an application’s workloads were handled by the CPU and GPU. It gives insight into how geometry, shaders and texture affect performance.
By default, counters are time-based and sample at a fixed frequency. You can also capture them in an event-based mode. You can select a type of hardware event, such as a level 2 cache miss, and then take a counter sample every n occurrences of this event.
Aside from counters, you can also see scheduling information from the Linux kernel or from Arm GPU drivers. You can also view software-generated annotations from the application being profiled. The Mali Timeline, new in 2025.4, gives more detailed insight into GPU scheduling.
Performance Advisor
Streamline also includes Performance Advisor, which generates overview reports from a selection of metrics. Generate Performance Advisor reports alongside your regular build process, as part of a continuous integration (CI) workflow
RenderDoc for Arm GPUs
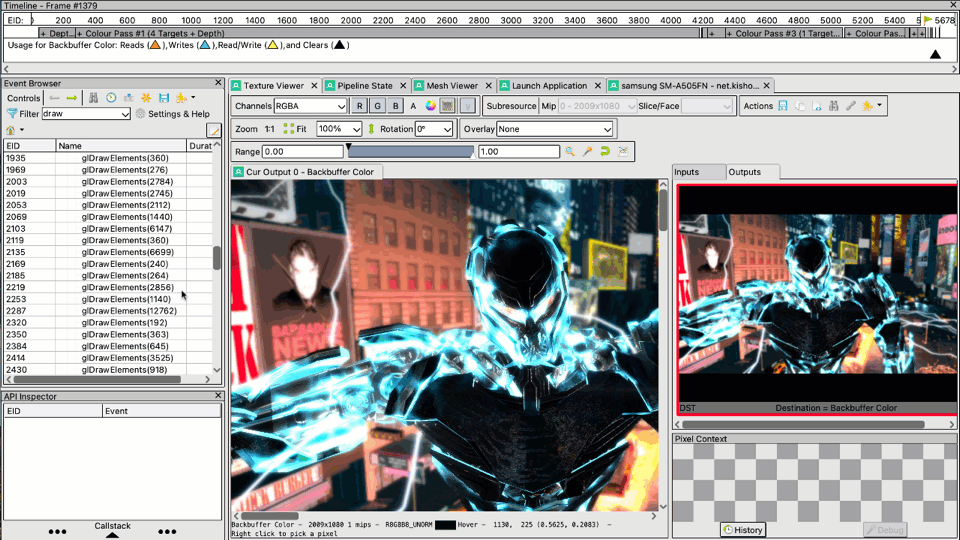
You can debug graphics on Arm Mali or Immortalis hardware using RenderDoc for Arm GPUs. Arm’s fork of this open-source project supports developers targeting Android or automotive Linux systems, or developing on a MacOS host. Compared to Frame Advisor, RenderDoc has greater support for the latest graphics tools & techniques, such as Vulkan ray tracing with VK_EXT_opacity_micromap.
Mali Offline Compiler
Mali Offline Compiler provides shader analysis to predict performance bottlenecks across multiple generations of Arm GPUs. This command-line tool integrates into shader development workflows, including CI. As it is a static analysis tool, there is no need to connect to a target device.
Further information
Each tool within Arm Performance Studio comes with a user guide and documentation. Many additional resources are also available to help you get started with Arm Performance Studio. A few highlights are:
- The Arm GPU Training video series about graphics rendering on Arm Mali or Immortalis GPUs.
- A range of Arm Learning Paths relevant to graphics performance for gaming on Android.
Support and community
Alongside the tools themselves, Arm also offers a range of community discussion, support and feedback mechanisms:
- The Arm Developer Program can help you up-skill, connect with experts and optimize on Arm. The program provides a community Discord server, as well as exclusive events and live sessions.
- You can see the latest discussions, learn from experienced users, or ask a question in the Arm Graphics, Gaming, and VR community forum.
- The Arm Mobile, Graphics & Gaming blog is regularly updated with content relevant to Arm Performance Studio users.
- To ask a question directly, you can email the Arm Performance Studio team at performancestudio@arm.com.
Install Arm Performance Studio to get started. It is free to download and use!
By Jai Schrem
Re-use is only permitted for informational and non-commercial or personal use only.
